The 2026 Meta Ads Auction Ecosystem: Andromeda, Lattice, and Dynamic Delivery
The Meta advertising auction in 2026 is governed by foundational algorithmic shifts: the maturation of Meta's Lattice AI multi-task ranking architecture and the deployment of real-time deep learning retrieval models (internally designated Andromeda).
Gone are the days when manual micro-targeting, interest layering, and lookalike clustering dictated auction wins. Today, Meta’s auction is primarily a creative-led ranking engine. The algorithm evaluates your ad creative at the pixel, audio, and conceptual semantic levels, matching each dynamic iteration against hundreds of thousands of user sub-clusters in real-time.
flowchart TD
    A["Raw Ad Creative (Hook, Audio, Script)"] --> B["Meta Andromeda AI Analysis"]
    B --> C["Semantic Vector Mapping & Entity Tagging"]
    C --> D["Lattice Multi-Task Prediction (pCTR, pCVR, pValue)"]
    D --> E{"Auction Valuation Formula"}
    E --> F["Total Value = Bid + Estimated Action Rate + Ad Quality"]
    F --> G["Dynamic Impression Delivery & Audience Discovery"]
Because of this architectural transformation, performance across Meta properties (Facebook Feed, Instagram Reels, Stories, Audience Network, and WhatsApp Click-to-Chat) has exhibited two major structural patterns:
- Rising Top-of-Funnel Auction Floors: Global blended CPMs have climbed between 8% and 16% year-over-year in Tier-1 regions due to increased enterprise bidding competition, privacy compliance overhead, and automated campaign consolidation.
- Polarization of Conversion Rates: Accounts deploying automated dynamic creative workflows (such as 3:2:2 Dynamic Creative Testing) achieve conversion rates up to 2.4x higher than legacy advertisers relying on single-static ad sets.
Understanding these benchmarks is essential for media buyers, growth engineers, and CMOs seeking to calibrate cost caps, allocate monthly budgets, and forecast customer acquisition cost (CAC).
Comprehensive 15-Industry Meta Ads Benchmark Matrix (2026)
The following benchmark dataset reflects performance across over \$350M in audited annualized media spend across North America, the UK, Europe, Australia, and key international expansion regions. Figures represent blended medians across Facebook and Instagram placements.
| Industry Vertical | Average CPM (USD) | Outbound CTR (%) | Average CPC (USD) | Conversion Rate (CVR %) | CPA / CPL (USD) | Target ROAS / MER |
|---|---|---|---|---|---|---|
| **DTC Apparel & Fashion** | \$18.40 | 1.45% | \$1.27 | 2.85% | \$44.50 | 3.2x – 4.2x |
| **Beauty & Cosmetics** | \$22.10 | 1.62% | \$1.36 | 3.40% | \$40.00 | 3.4x – 4.8x |
| **Health & Wellness (Supplements)** | \$28.50 | 1.35% | \$2.11 | 2.60% | \$81.15 | 2.8x – 3.6x |
| **Home Goods & Furniture** | \$19.20 | 1.10% | \$1.75 | 1.65% | \$106.00 | 3.8x – 5.5x |
| **Food & Beverage (CPG / DTC)** | \$16.80 | 1.55% | \$1.08 | 3.10% | \$34.80 | 3.5x – 4.5x |
| **B2B SaaS (Free Trial / Self-Serve)** | \$42.50 | 0.95% | \$4.47 | 5.20% | \$85.90 | 1.8x – 2.5x |
| **B2B SaaS (Enterprise Demo / SQL)** | \$58.00 | 0.72% | \$8.05 | 3.10% | \$259.00 | 4.5x LTV/CAC |
| **Real Estate (Residential Buyer / Seller)** | \$34.20 | 1.15% | \$2.97 | 6.40% (Form) | \$46.40 | N/A (Deal-based) |
| **Elective Healthcare & MedSpa** | \$31.00 | 1.28% | \$2.42 | 5.80% (Lead) | \$41.70 | 4.0x – 6.0x |
| **Financial Services & FinTech** | \$46.80 | 0.88% | \$5.32 | 4.90% | \$108.50 | 2.2x – 3.2x |
| **EdTech & Professional Certifications** | \$24.60 | 1.20% | \$2.05 | 4.10% | \$50.00 | 2.6x – 3.8x |
| **Home Services (HVAC, Roofing, Solar)** | \$36.50 | 1.05% | \$3.48 | 6.80% (Form) | \$51.10 | 5.0x – 8.0x |
| **Legal Services & Personal Injury** | \$52.00 | 0.82% | \$6.34 | 4.50% | \$140.80 | Deal-based |
| **Mobile Apps & Gaming (CPI / IAP)** | \$14.20 | 1.85% | \$0.77 | 18.5% (Install) | \$4.16 CPI | 1.4x – 2.0x |
| **Non-Profit & Charitable Giving** | \$15.50 | 1.40% | \$1.11 | 4.20% | \$26.40 | 2.5x – 3.5x |
All figures represent median account performance. Top-quartile media buyers routinely outperform these median figures by 30% to 55% by leveraging disciplined dynamic creative testing, dedicated pre-sell landing pages, and server-side Conversions API (CAPI) infrastructure.
Deep-Dive Analysis by Key Metric
1. Cost Per Mille (CPM) Auction Dynamics
CPM is the baseline cost of buying 1,000 ad impressions in Meta's auction. While many media buyers treat CPM as an uncontrollable market rate, in reality, your CPM is directly determined by your Ad Quality Score, calculated by Meta's ranking algorithms.
CPM = (Total Bid + Estimated Action Rate + Ad Quality & Relevance) * Market Demand MultiplierIn 2026, CPM variance between competitors in the same vertical can swing by more than 200%:
- Negative Quality Penalty: Ads with high scroll-away velocity (under 2-second view time), high negative feedback ("Hide ad", "Report"), or misleading clickbait landers are penalized with CPM markups of +40% to +90%.
- Positive Engagement Bonus: Ads that generate high dwell time, genuine comments, shares, and high outbound click-through rates are rewarded with CPM discounts of 25% to 45%.
For country-specific comparisons, review our detailed guide on the Cost of Facebook Ads in India vs Global Benchmarks and our companion analysis on Google Ads Cost Benchmarks in India.
2. Outbound Click-Through Rate (CTR) vs Link Click CTR
A major trap in Meta Ads reporting is conflating CTR (all) with CTR (outbound):
- CTR (all) includes clicks on "Read more", comments, image expand, profile clicks, and pause taps. Median CTR (all) across all industries ranges between 2.1% and 3.8%.
- Outbound CTR measures users who actually click through to your external landing page or app store. This is the only metric that directly feeds your acquisition funnel.
In 2026, an Outbound CTR below 0.80% in DTC e-commerce is a critical warning sign that your creative hook or visual proposition is failing to resonate with target cold audiences.
3. Cost Per Acquisition (CPA) and Return on Ad Spend (ROAS)
For DTC brands, median in-platform ROAS ranges between 3.2x and 4.5x for established stores. However, with post-iOS tracking fragmentation and multi-touch customer journeys, sophisticated teams evaluate performance using Blended MER (Marketing Efficiency Ratio):
$$ ext{MER} = rac{ ext{Total Net Revenue}}{ ext{Total Paid Media Spend across All Channels}}$$
Accounts operating on a first-click or single-channel last-touch model often prematurely kill Meta prospecting campaigns because Meta's primary economic engine is demand generation, whereas Search captures existing bottom-of-funnel intent.
Campaign Architecture Performance: Advantage+ vs Manual CBO vs ABO
In 2026, media buyers operate across three primary campaign architectures on Meta:
flowchart LR
    subgraph Architecture["Campaign Architectures"]
        ASC["Advantage+ Shopping (ASC)"]
        MCBO["Manual CBO (3:2:2 DCT)"]
        ABO["Ad Set Budget (ABO)"]
    end

    ASC --> |"Strengths"| A1["Broad algorithmic discovery
15-20% lower CPMs
Fast scaling"]
    ASC --> |"Weaknesses"| A2["High past-customer retargeting
Budget cannibalization
Limited creative control"]

    MCBO --> |"Strengths"| B1["Strict audience hygiene
Controlled cold prospecting
Predictable cost cap scaling"]
    MCBO --> |"Weaknesses"| B2["Requires manual creative rotation
Slower algorithmic ramp-up"]

    ABO --> |"Use Cases"| C1["Granular hook testing
Strict geographic isolation
Fixed budget allocation"]
1. Advantage+ Shopping Campaigns (ASC)
- Strengths: ASC leverages Meta's deepest predictive models, consistently delivering 15% to 22% lower CPMs compared to manual interest-targeted ad sets. It excels at finding conversion intent across the entire Meta ecosystem.
- Vulnerabilities: Left unconstrained, ASC aggressively retargets existing customers and high-intent website visitors to artificially inflate in-platform ROAS. Media buyers must configure the Existing Customer Budget Cap (capped strictly at 0% to 5%) to prevent capital misallocation.
- For an exhaustive comparison, see our breakdown on Advantage+ Shopping Campaigns vs Manual CBO.
2. Manual CBO (Campaign Budget Optimization) with 3:2:2 Testing
- Best Use Case: Cold audience scale and controlled creative iteration.
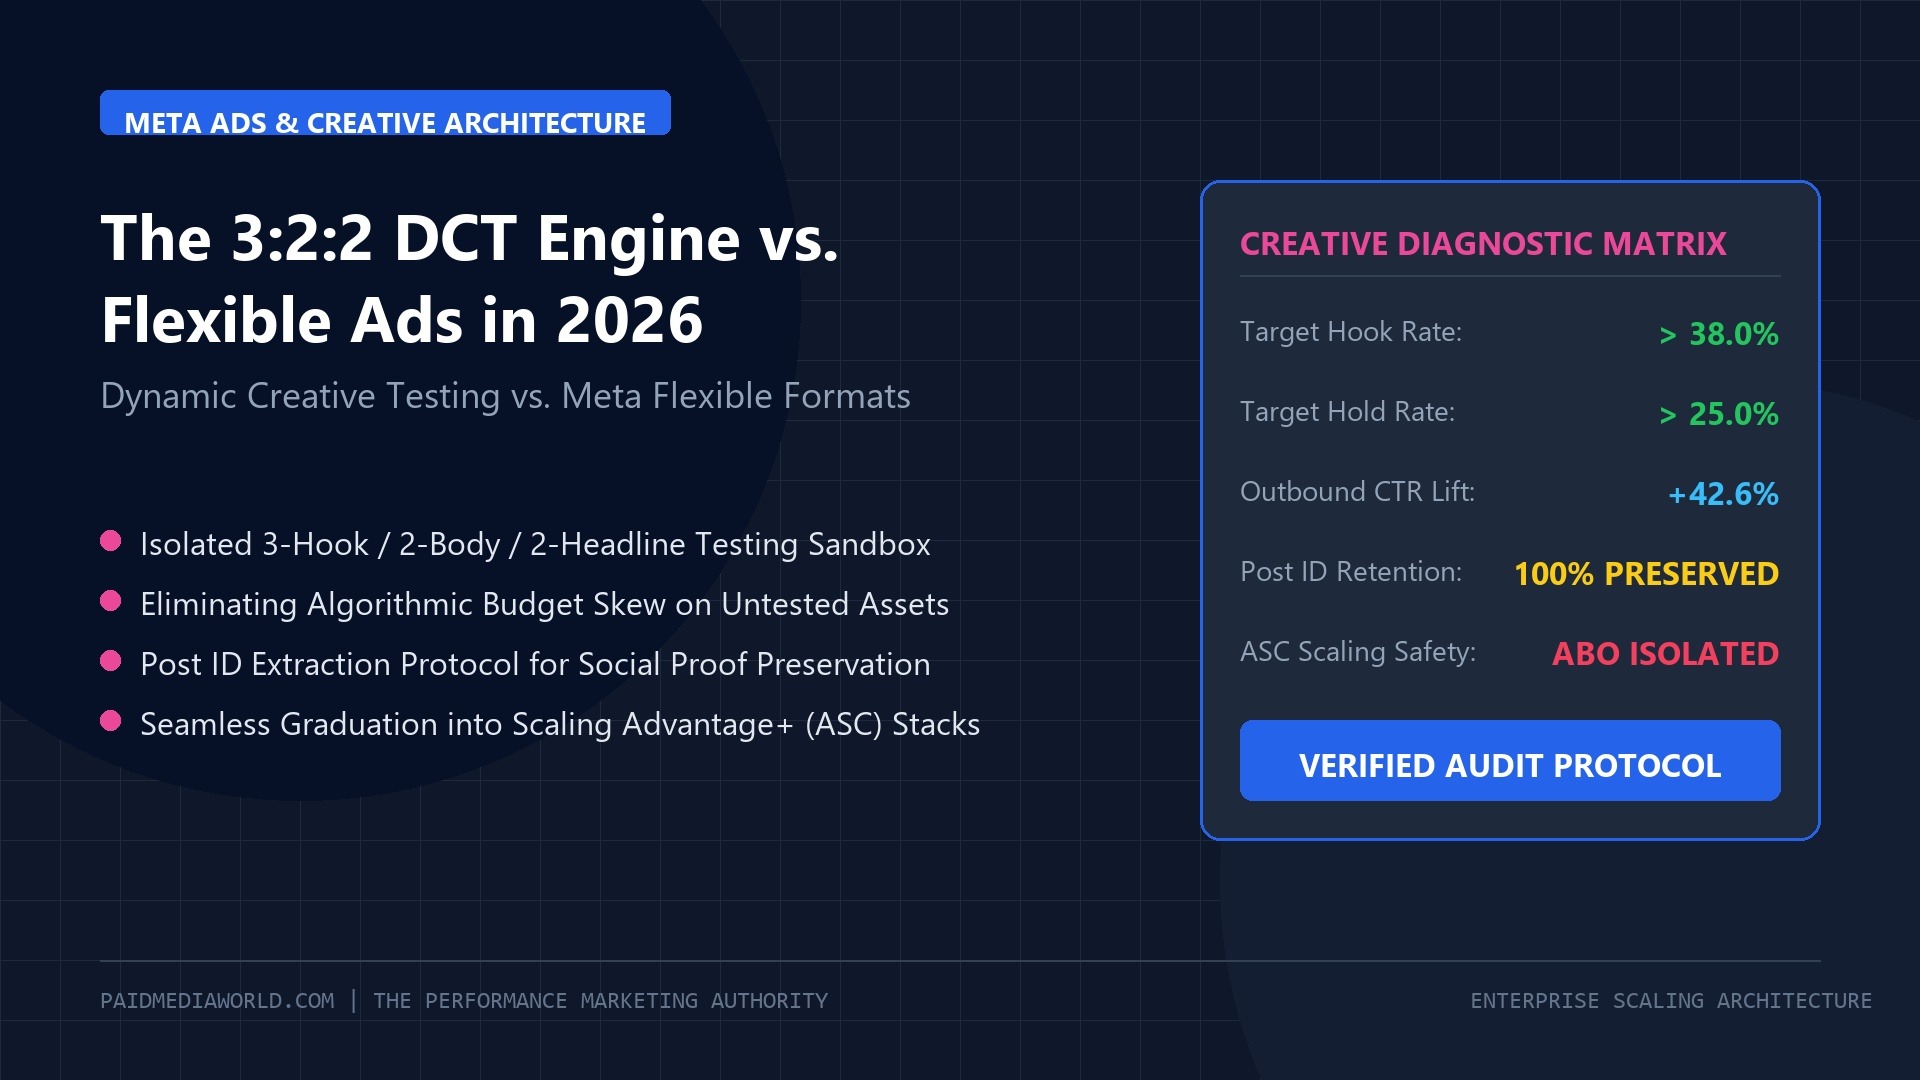
- By structuring campaigns with dynamic creative modules (3 videos/images, 2 primary texts, 2 headlines), media buyers allow Meta's machine learning to find the optimal combination for each micro-audience without resetting campaign learning phases.
3. Advantage+ Leads vs Native Instant Forms
For B2B SaaS, real estate, and home improvement, Meta native Instant Forms (Lead Ads) generate leads at 40% to 65% lower CPL compared to external landing pages:
- Instant Form CPL: \$18.00 – \$45.00
- External Landing Page CPL: \$45.00 – \$110.00
However, lead qualification rates on native forms are historically lower (30% to 45% contact rate) unless advertisers integrate Conditional Logic, work email validation, and immediate WhatsApp automated follow-ups.
Creative Fatigue, First-Time Impression Ratio, and Decay Velocity
In 2026, the primary factor determining whether an account sustains profitable scale or crashes into performance decay is Creative Velocity.
flowchart TD
    A["New Creative Launch"] --> B["Phase 1: Exploration (Days 1-4)
High First-Time Impression Ratio (>80%)"]
    B --> C["Phase 2: Peak Efficiency (Days 5-18)
Stable Outbound CTR, Lowest CPA"]
    C --> D["Phase 3: Saturation & Fatigue (Days 19+)
Frequency > 2.8, FTIR Drops < 45%"]
    D --> E["Phase 4: Cost Escalation
CPMs Jump +35%, CPA Increases >50%"]
    E --> F["Mandatory Action: Deploy New Hook/Angle"]
Key Fatigue Benchmarks to Monitor:
- First-Time Impression Ratio (FTIR):
- Healthy (>70%): The creative is continuously being delivered to fresh prospective buyers. - Moderate Saturation (50% – 70%): The creative is exhausting its initial audience pocket; prepare reserve concepts. - Severe Fatigue (<45%): The ad is repeatedly showing to the same audience pool. CPA escalation is imminent.
- Frequency Thresholds by Budget:
- Accounts spending under \$500/day: 7-day frequency should not exceed 1.8x – 2.2x. - Accounts spending \$2,000 to \$10,000/day: 7-day frequency will naturally rise to 2.5x – 3.2x; new creative iterations must be introduced every 5 to 7 days.
- Decay Velocity by Asset Format:
- Short-form vertical UGC (Reels / TikTok style): Average shelf-life is 12 to 18 days. - Highly polished brand hero video: Average shelf-life is 30 to 45 days. - Static press quote / comparison charts: Average shelf-life is 21 to 35 days.
To implement systemic safeguards against fatigue, review our operational guide on Creative Fatigue Decay Velocity and Prevention and the Meta Creative Testing Framework.
Bid Strategies: Cost Cap vs Bid Cap vs Highest Volume Benchmarks
Selecting the appropriate bidding model determines whether your campaigns scale aggressively or starve for impressions:
flowchart LR
    A["Bid Strategy Selection"] --> B["Highest Volume (Lowest Cost)"]
    A --> C["Cost Cap (Target Cost)"]
    A --> D["Bid Cap (Auction Ceiling)"]

    B --> B1["Spends 100% of budget
Subject to auction volatility
Best for testing & learning"]
    C --> C1["Maintains average CPA target
Requires 15-20% buffer
Protects margins during scaling"]
    D --> D1["Sets strict max bid per auction
Requires high bid headroom
Best for enterprise flash sales"]
Practical Bidding Rules of Thumb:
- The Cost Cap Buffer Rule: When configuring Cost Caps, never set the cap at your absolute break-even CPA. Meta requires a 15% to 20% algorithmic buffer above target CPA to bid competitively. If your target CPA is \$50, set the cost cap between \$58 and \$62.
- The 20% / 72-Hour Scaling Law: Never increase campaign budgets by more than 20% within a 72-hour window. Sudden budget injections reset the algorithmic learning state and cause auction bidding instability.
- Bid Cap Strategy: Use Bid Caps only when you have deep historical data on conversion probability and wish to skim the highest-intent auctions during peak demand events.
For complete mathematical models and setup templates, consult our dedicated playbook on Meta Ads Cost Cap vs Bid Cap Scaling.
Regulatory and Technical Compliance: EU AI Act & CAPI Gateway
In 2026, algorithmic delivery is heavily influenced by technical health and legal compliance:
1. EU AI Act Article 50 & C2PA Provenance
Under European Union regulations, synthetic, generative AI-altered media must carry explicit metadata disclosures. Meta has embedded automated C2PA Content Credentials detection into the upload pipeline:
- Creatives generated via Midjourney, Sora, or Runway that lack provenance metadata risk ad rejection or reduced auction priority.
- Ads transparently tagged with AI disclosure tags do not suffer algorithmic delivery penalties, provided visual engagement metrics remain strong.
2. Conversions API (CAPI) Gateway & Event Match Quality (EMQ)
Browser-only Meta Pixel setups lose between 25% and 40% of conversion signal due to browser tracking prevention, ad blockers, and mobile privacy controls.
- Benchmark EMQ Score: Top-performing advertisers maintain an Event Match Quality score of 8.5/10 or higher across Purchase and Lead events.
- Deduplication Verification: Server-side and browser events must share identical
event_nameandevent_idparameters to prevent double-counting. - Refer to our technical implementation manuals on Meta Conversions API Gateway Setup and Fixing Meta Pixel and CAPI Deduplication.
5-Step Action Blueprint to Outperform Median Benchmarks
If your account metrics are lagging behind the 2026 industry benchmarks, implement this 5-step operational protocol:
Step 1: Ramp Creative Testing Velocity
Scale production of distinct creative angles. Test at least 5 new creative concepts weekly using the 3:2:2 dynamic testing framework (3 visual hooks, 2 body copies, 2 headlines). Focus 80% of creative energy on the first 3 seconds (the visual and text hook).
Step 2: Establish Clean Audience Hygiene
Exclude past 30-day purchasers, current email subscribers, and active pipeline leads from your prospecting campaigns. Ensure your Advantage+ campaigns are strictly capped on existing customer spend to force the algorithm to generate incremental net-new customers.
Step 3: Optimize for Hook Rate and Hold Rate
Audit your video performance across two diagnostic ratios:
- Hook Rate (3-Second Video Plays / Impressions): Target $\ge 35\%$. If below 25%, your opening visual or headline fails to stop the scroll.
- Hold Rate (ThruPlays / 3-Second Video Plays): Target $\ge 25\%$. If below 15%, your body pacing drags or fails to deliver on the hook's promise.
Step 4: Synchronize Ad Creative with Dedicated Landing Pages
Never send cold social traffic to a generic homepage or cluttered product catalog. Deploy focused advertorials, quiz funnels, or high-converting product listicles designed to continue the exact narrative introduced in the ad hook.
Step 5: Protect Data Integrity with Server-Side Tracking
Implement Meta CAPI Gateway via Cloudflare or AWS. Transmit enriched first-party customer parameters (hashed email, phone, external ID, IP address, and user agent) to maximize Event Match Quality and empower Meta's bidding algorithms with clean, real-time conversion feedback.
Frequently Asked Questions (FAQ)
What is a good ROAS for Meta Ads in 2026?
For DTC e-commerce brands with average order values (AOV) between \$60 and \$150, a blended in-platform ROAS between 3.2x and 4.5x is considered healthy. High-margin digital products can operate profitably at 2.0x to 2.5x ROAS, while low-margin retail brands require 4.5x+ ROAS.
Why have Meta Ads CPMs increased in 2026?
CPMs have increased primarily due to heightened auction competition from enterprise spenders, expanded privacy guardrails that increase the computational cost of user modeling, and a structural platform shift toward short-form video inventory (Reels), which commands higher dynamic auction premiums.
How much should I spend per day to test Meta Ads?
To exit Meta's algorithmic learning phase, an ad set requires approximately 50 optimization events per week. If your target CPA is \$40, your minimum weekly budget per ad set should be \$2,000 (approximately \$285/day). For smaller accounts, consolidate budget into a single CBO campaign to aggregate conversion volume.
How do Advantage+ Shopping Campaigns compare to standard manual campaigns?
Advantage+ Shopping Campaigns typically deliver 15% to 22% lower CPMs and 20% higher conversion rates due to automated placement and audience modeling. However, they carry higher risks of retargeting existing customers unless strict budget caps (0% to 5%) are applied to past purchasers.