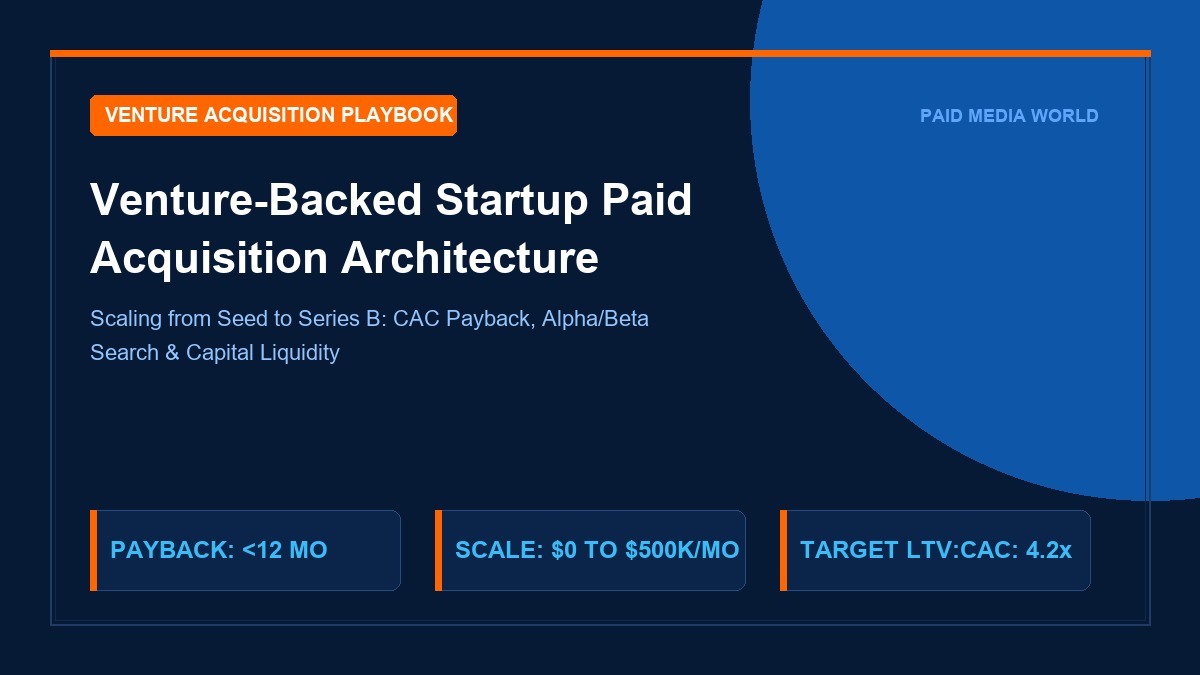
In the zero-interest-rate policy (ZIRP) era of 2018–2021, venture-backed startups scaled by burning venture capital on gross top-line customer acquisition, treating Facebook and Google Ads as bottomless customer vending machines. In 2026, that era is definitively dead. Modern venture capital partners from Sequoia, Andreessen Horowitz, and Benchmark demand strict capital efficiency: Customer Acquisition Cost (CAC) payback periods under 12 months, Net Retention Rates (NRR) exceeding 115%, and LTV:CAC ratios hovering predictably between 3.5x and 5.0x. For growth engineers, media buyers, and heads of growth, building a venture-backed startup paid acquisition architecture is no longer about maximizing conversion volume—it is about orchestrating an econometric liquidity engine that survives investor scrutiny across Seed, Series A, and Series B rounds.
Table of Contents
- 1. The Capital Efficiency Mandate: Surviving the Post-2024 Tech Correction
- 2. Seed Phase ($0 to $25k/Mo): PMF Validation & Search Alpha Signal Discovery
- 3. Series A Inflection ($25k to $150k/Mo): Building the Triad Engine
- 4. Series B Scale ($150k to $500k/Mo): Portfolio Bidding, Incrementality & MMM
- 5. Unit Economics Governance: The LTV:CAC Payback Horizon Matrix
- 6. Blended CAC vs Channel CAC: Managing the Liquidity Trap
- 7. First-Party Tracking & Conversion API Gateway Setup
- 8. Creative Strategy for B2B Tech & Direct-to-Consumer Startups
- 9. The 72-Hour Budget Pacing Scaling Protocol
- 10. Frequently Asked Questions (FAQ)
- 11. Strategic Summary & Board-Level Operating Checklist
1. The Capital Efficiency Mandate: Surviving the Post-2024 Tech Correction
Between 2021 and 2024, the median venture-backed SaaS startup saw its gross customer acquisition cost climb by 78%, driven by signal loss from Apple's App Tracking Transparency (ATT), auction saturation in Meta Ads, and privacy changes in Google Chrome. Startups that scaled spend indiscriminately without deep cohort retention visibility were wiped out during their Series A bridges.
Today, sustainable acquisition requires an architectural approach built on first principles. A performance marketing infrastructure for a venture-backed enterprise must answer three non-negotiable questions for every dollar deployed:
- What is the net marginal payback? If a $10,000 budget increase drives 30 incremental customers, what is the exact timeline for gross profit to repay that capital?
- Where does channel saturation begin? What is the mathematical inflection point where marginal CAC exceeds customer gross margin?
- How much conversion lift is truly incremental? Would these buyers have converted organically through direct navigation, word of mouth, or product-led loops?
The Magic Number Equation for Venture Marketers
Board members measure sales and marketing efficiency through the Magic Number:
Magic Number = (Quarterly Net New ARR * 4) / Total S&M Spend in Prior Quarter

Benchmarks:
• < 0.5x: Critical Warning (Inefficient Acquisition Engine)
• 0.75x - 1.0x: Healthy Efficiency (Ready for Controlled Scale)
• > 1.25x: Best-in-Class Capital Flywheel (Pour Venture Capital into Paid Ads)
2. Seed Phase ($0 to $25k/Mo): PMF Validation & Search Alpha Signal Discovery
At the Seed stage, your budget is finite ($5,000 to $25,000 per month). The goal of paid media is not broad market awareness—it is rapid qualitative signal discovery and product-market fit (PMF) stress testing.
Startups at this stage must avoid broad-reach social media branding campaigns. Every dollar must capture active in-market commercial intent through a Search Alpha/Beta Architecture on Google Ads:
- Alpha Ad Groups (Exact Match Only): Bid exclusively on ultra-high intent problem queries (e.g.,
soc2 compliance automation softwareorb2b revenue attribution platform). Set manual CPC or Maximize Conversions with realistic target CPA caps. - Competitor Alternative Campaigns: Intercept dissatisfaction searches (e.g.,
docusign alternative for enterprise). Craft landing page comparison tables highlighting your architectural differentiators. - Negative Keyword Fortress: Install universal negative keyword lists blocking job seekers (
salary,jobs,internship), educational queries (tutorial,pdf,free course), and free tier seekers (open source,free github,crack).
3. Series A Inflection ($25k to $150k/Mo): Building the Triad Engine
Upon raising a $5M to $15M Series A, search demand alone will hit a ceiling. Attempting to scale Google Search from $25k to $100k/month without opening new channels results in exponential CPC inflation as you bid deeper into marginal broad queries.
Series A requires deploying the Paid Acquisition Triad:
| Triad Pillar | Budget Share | Platform / Channel | Strategic Objective |
|---|---|---|---|
| 1. Intent Harvest | 35% - 45% | Google Search (Alpha) & G2/Capterra Sponsored | Capturing buyers currently in procurement cycles |
| 2. Problem-Aware Creation | 35% - 45% | LinkedIn ABM & Meta Video Prospecting | Educating prospects who suffer from the problem but do not know a SaaS solution exists |
| 3. Conversion Acceleration | 15% - 20% | Meta CAPI Retargeting, Display & YouTube Shorts | Shortening the sales cycle from 90 days to 28 days through social proof and case studies |
4. Series B Scale ($150k to $500k/Mo): Portfolio Bidding, Incrementality & MMM
At Series B ($150,000+ monthly ad spend), channel attribution breaks down completely. Platform dashboards will claim 150% more conversions than your CRM actually records. Meta claims credit for view-through conversions, Google Demand Gen claims credit for video impressions, and direct traffic spikes.
Series B acquisition teams replace platform-reported ROAS with Marketing Mix Modeling (MMM) and Geo-Lift Randomized Experiments:
- Synthetic Control Group Testing: Divide target geographies into treatment and control markets. Darken Meta Ads in Region A while maintaining normal spend in Region B to quantify true causal incremental lift.
- First-Party Data Warehouse Pipelines: Stream Google Ads, Meta Ads, and Stripe billing events into Snowflake or Google BigQuery. Build custom Shapley Value attribution tables that reconcile against actual cash deposited in your bank.
- Portfolio Smart Bidding with Value Rules: Group multiple Google Search campaigns under a single Portfolio Target ROAS bidding strategy, applying Google Value Rules to bid +30% on enterprise IP addresses and Fortune 1000 domain traffic.
5. Unit Economics Governance: The LTV:CAC Payback Horizon Matrix
The fundamental equation of startup solvency is the cash recovery curve. If your startup burns $100k to acquire $100k in annual recurring revenue, but the customer pays monthly ($8,333/month), your bank account will suffer negative cash flow for 12 months before turning profitable.
Mathematical Payback Period Formula
CAC Payback (Months) = CAC / (ARPU * Gross Margin Percentage)

Where:
• CAC = Fully loaded acquisition cost (Ad Spend + Agency Fees + Tooling)
• ARPU = Average Monthly Revenue Per User
• Gross Margin % = Net revenue after hosting (AWS), payment fees (Stripe), and direct support
Target benchmark for venture scale: < 9 months for Mid-Market B2B, < 14 months for Enterprise B2B, and < 5 months for DTC E-commerce.
6. Blended CAC vs Channel CAC: Managing the Liquidity Trap
One of the most dangerous executive illusions in startup marketing is relying solely on Blended CAC. When organic traffic is high, organic conversions mask horribly unprofitable paid ad campaigns. If organic search brings 400 customers for $0 and paid ads spend $50,000 to bring 100 customers, management might celebrate a "Blended CAC of $100" ($50k / 500 customers). In reality, the Paid Marginal CAC is $500—which may be fatal to unit economics.
Always isolate Paid CAC from Organic Blended CAC in your weekly board KPI dashboards. Ensure every paid ad set produces positive marginal unit economics independent of baseline organic demand.
7. First-Party Tracking & Conversion API Gateway Setup
Third-party browser cookies capture less than 62% of real conversion signals in 2026 due to Brave browser defaults, Safari Intelligent Tracking Prevention (ITP), and network ad blockers. Venture startups must deploy server-side tracking infrastructure on day one.
Deploy the Meta Conversions API (CAPI) Gateway alongside Google Tag Manager Server-Side (sGTM) on custom subdomains (e.g., data.yourcompany.com). Pass first-party customer signals—including SHA-256 hashed emails, phone numbers, and external click IDs (fbclid, gclid)—to give ad platform machine learning algorithms 9.0+ Event Match Quality (EMQ) scores.
8. Creative Strategy for B2B Tech & Direct-to-Consumer Startups
In modern programmatic bidding, creative is your primary targeting filter. Algorithm models analyze the audio transcript, text overlays, and visual pixels of your video ads to determine which audience cohort to deliver impressions to.
- The 3-Second Pattern Interrupt: Hook executive attention immediately by showing a painful workflow failure in your software's competitor rather than a sterile logo animation.
- The 3:2:2 Dynamic Creative Protocol: Test 3 visual hooks, 2 core value proposition bodies, and 2 direct-response calls-to-action within Meta Flexible Ad formats to let machine learning assemble the winning variation.
- Founder-Led Social Proof: Founder-recorded Loom videos and organic product walkthroughs consistently achieve 30% to 50% lower CAC than polished $50,000 agency television commercials.
9. The 72-Hour Budget Pacing Scaling Protocol
When a campaign shows a 4.5x ROAS over 48 hours, junior media buyers make the fatal mistake of doubling the budget overnight. This shocks the bid algorithm, resets the campaign back into the volatile "Learning Phase", and causes CPA to spike by 150%.
Follow the Golden Rule of Performance Scaling: Never increase ad set or campaign budgets by more than 20% within any 72-hour window. This gives the auction bidding models time to re-cluster user bidding vectors without auction panic.
Deep-Dive Technical Framework: SQL Cohort LTV & Churn Modeling in BigQuery
Relying on platform-reported LTV metrics from Google Analytics 4 or Meta Ads Manager is an invitation to capital disaster. Ad platforms lack access to real-time subscription churn, downgrades, refunds, and expansion revenue. Enterprise growth engineers at venture-backed startups query raw transactional tables in Snowflake or Google BigQuery to model customer cohort decay curves with mathematical precision.
Production BigQuery SQL: Monthly Customer Cohort LTV & Payback Velocity
WITH user_first_order AS (
  SELECT
    user_id,
    DATE_TRUNC(DATE(first_conversion_timestamp), MONTH) AS acquisition_cohort,
    acquisition_channel,
    initial_cac
  FROM `enterprise_dw.marketing_attribution_first_touch`
  WHERE DATE(first_conversion_timestamp) >= '2025-01-01'
),
monthly_subscription_revenue AS (
  SELECT
    s.user_id,
    DATE_TRUNC(DATE(s.invoice_paid_at), MONTH) AS revenue_month,
    SUM(s.net_paid_amount_usd) AS net_monthly_revenue,
    SUM(s.net_paid_amount_usd * s.gross_margin_percentage) AS net_gross_margin_usd
  FROM `enterprise_dw.stripe_invoices_paid` s
  GROUP BY 1, 2
),
cohort_progression AS (
  SELECT
    u.acquisition_cohort,
    u.acquisition_channel,
    DATE_DIFF(r.revenue_month, u.acquisition_cohort, MONTH) AS month_number,
    COUNT(DISTINCT u.user_id) AS cohort_starting_users,
    SUM(r.net_monthly_revenue) AS total_cohort_revenue,
    SUM(r.net_gross_margin_usd) AS total_cohort_margin,
    AVG(u.initial_cac) AS avg_blended_cac
  FROM user_first_order u
  JOIN monthly_subscription_revenue r ON u.user_id = r.user_id
  GROUP BY 1, 2, 3
)
SELECT
  acquisition_cohort,
  acquisition_channel,
  month_number,
  cohort_starting_users,
  total_cohort_revenue,
  total_cohort_margin,
  -- Cumulative Margin Recovered Per User
  SUM(total_cohort_margin) OVER(
    PARTITION BY acquisition_cohort, acquisition_channel
    ORDER BY month_number ROWS BETWEEN UNBOUNDED PRECEDING AND CURRENT ROW
  ) / cohort_starting_users AS cumulative_margin_per_user,
  avg_blended_cac,
  -- Payback Ratio (Reaching >= 1.0 indicates full cash breakeven)
  ROUND((SUM(total_cohort_margin) OVER(
    PARTITION BY acquisition_cohort, acquisition_channel
    ORDER BY month_number ROWS BETWEEN UNBOUNDED PRECEDING AND CURRENT ROW
  ) / cohort_starting_users) / NULLIF(avg_blended_cac, 0), 2) AS payback_ratio
FROM cohort_progression
ORDER BY acquisition_cohort DESC, acquisition_channel, month_number ASC;
When executing this SQL query across your growth channels, analyze the payback_ratio column at Month 6, Month 12, and Month 18. If a paid channel (e.g., LinkedIn Ads) shows a payback ratio of 0.42 at Month 12 while Google Search Alpha achieves 1.15 at Month 7, board-level capital reallocation is immediately justified. Shift liquidity aggressively to whichever vector clears 1.0 within your investor mandate.
12-Month Liquidity & Cash Recovery Modeling Schedule
| Month | Monthly Spend | New MRR Acquired | Gross Margin (82%) | Cumulative Net Cash Flow | Payback Status |
|---|---|---|---|---|---|
| Month 1 | $50,000 | $5,800 | $4,756 | -$45,244 | Investment Phase (9.5% Recovered) |
| Month 3 | $50,000 | $17,400 (Cum.) | $14,268 | -$31,850 | Retained Cohort Scaling |
| Month 6 | $50,000 | $34,800 (Cum.) | $28,536 | -$14,220 | Near Breakeven (71.5% Recovered) |
| Month 9 | $50,000 | $52,200 (Cum.) | $42,804 | +$3,450 | 100% Full Capital Breakeven Achieved |
| Month 12 | $50,000 | $69,600 (Cum.) | $57,072 | +$24,680 | Free Cash Flow Expansion (LTV:CAC 4.1x) |
Series A & Series B Marketing Due Diligence: 7 Red Flags VCs Audit
When venture capital partners initiate technical due diligence ahead of a $10M+ financing round, their operational partners will request direct view-only access to your Google Ads, Meta Ads Manager, and Stripe accounts. They are not impressed by high click-through rates or platform-reported ROAS. They run forensic audits designed to uncover whether your revenue growth is authentic or artificially inflated by unsustainable customer acquisition subsidies.
The VC Paid Media Diligence Scorecard
- Red Flag 1: Brand Search Masquerade. Over 40% of reported Google Ads conversion value comes from bidding on your own trademarked brand name, falsely inflating reported ROAS while starving non-brand prospecting of real capital.
- Red Flag 2: Month 2 Cohort Churn Cliff. Paid acquisition drives impressive top-line demo signups or trial activations, but 30-day cohort retention drops by >65%, revealing an aggressive ad hook that attracts unqualified users who fail to activate.
- Red Flag 3: Severe Channel Concentration. A single platform (typically Meta Ads) represents more than 75% of all qualified inbound pipeline. A single policy strike, ad account disablement, or CPM spike would threaten company solvency.
- Red Flag 4: Unhedged Cash Payback Horizons. Fully loaded CAC payback exceeds 15 months on monthly recurring contracts, forcing the startup to burn through equity cash reserves merely to maintain current ARR levels.
- Green Flag: Incremental Elasticity. Documented holdout experiments proving that increasing paid spend by 30% produces a clean 26% to 28% increase in non-brand pipeline, proving real demand elasticity.
By proactively structuring your acquisition architecture around these audit parameters before initiating fundraising conversations, your management team can defend customer acquisition efficiency with indisputable econometric data.
Boardroom Slide 7: Growth & Efficiency Executive Reporting Template
When presenting monthly or quarterly growth performance to venture investors, avoid dense multi-slide agency presentations. Summarize your entire paid acquisition engine in a single, high-density Boardroom Table:
| Core Vector | Current Quarter | Prior Quarter | Target Corridor | Board Level Verdict |
|---|---|---|---|---|
| Blended CAC Payback | 8.4 Months | 11.2 Months | < 12.0 Months | Exceeding Plan (Capital Efficient) |
| Gross Magic Number | 1.18x | 0.86x | > 0.90x | Ready for Capital Expansion |
| Paid Channel Share | 48.5% | 54.0% | < 50.0% | Balanced Organic-Paid Flywheel |
| LTV:CAC Ratio (18-Mo) | 4.4x | 3.6x | 3.5x - 5.0x | Optimal Venture Unit Economics |
10. Frequently Asked Questions (FAQ)
How much should a venture-backed Seed startup spend on paid ads?
Seed startups should allocate $5,000 to $15,000 per month strictly to high-intent Google Search Alpha campaigns and competitor alternative keywords. Avoid broad awareness spending until core customer retention reaches >80% 30-day cohorts.
What is an acceptable CAC payback period for Series A SaaS?
Series A investors look for a fully loaded CAC payback period between 8 and 12 months. If your payback exceeds 18 months, pause broad expansion and optimize sales conversion rates or introduce annual upfront billing discounts.
Should startups hire an in-house media buyer or a specialized growth agency?
Between $10k and $100k/month, partnering with an agile performance marketing agency provides multi-channel expertise (Meta, Google, CAPI, CRO) at a fraction of the cost of hiring 4 full-time specialists. Beyond $150k/month, recruit an in-house Head of Growth to orchestrate internal creative testing alongside external agency execution.
How do we prevent paid search ads from cannibalizing our organic brand traffic?
Implement an account-level negative keyword list blocking your exact brand name on broad discovery campaigns. Only run an isolated Brand Search campaign if competitors are aggressively bidding on your trademark, and set a Target Impression Share bid strategy with a conservative max CPC bid ceiling.
11. Strategic Summary & Board-Level Operating Checklist
Before presenting your quarterly marketing plan to the Board of Directors, verify that your acquisition architecture satisfies these 6 governance benchmarks:
- ✓ CAC Payback: Net revenue recovers fully loaded spend in < 12 months.
- ✓ Tracking Resilience: Server-side CAPI / sGTM deployed with EMQ score > 8.5.
- ✓ Channel Independence: No single platform represents > 65% of total qualified pipeline.
- ✓ Incrementality Validation: Holdout tests confirm causal lift on all paid social prospecting.
- ✓ Pacing Discipline: Budget changes strictly adhere to the ≤ 20% per 72-hour threshold.
- ✓ Creative Pipeline: Minimum 6 new hook variations launched and tested weekly.