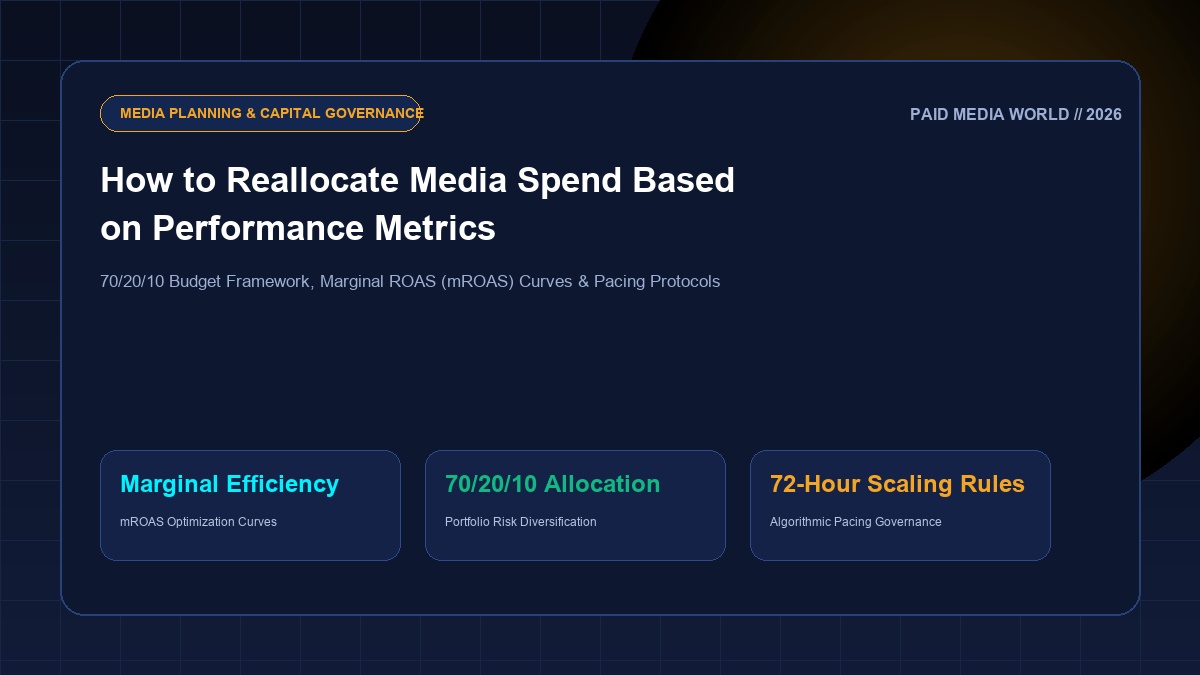
Most growth marketing teams manage media budgets using an obsolete, linear mental model: they identify the channel reporting the highest Average ROAS (e.g. Google Search at 4.2x vs Meta Ads at 2.6x) and systematically shift capital into the winning channel until performance collapses. This is the Average ROAS Trap: failing to account for the economic law of diminishing marginal returns. Every additional dollar injected into an ad platform generates less incremental revenue than the dollar before it. When a high-performing channel reaches audience saturation, its Marginal ROAS (mROAS) plummets below break-even, even while its reported average ROAS still looks sparkling in monthly executive slide decks. High-performance marketing organizations manage capital like asset managers, deploying Marginal Efficiency Curves, the 70/20/10 Portfolio Framework, and Systematic 72-Hour Pacing Reallocations. This comprehensive blueprint details the exact capital allocation models, formulas, and Python scripts required to reallocate multi-channel ad spend dynamically to maximize enterprise profit.
Table of Contents
- 1. The Average ROAS Trap: Why Optimizing on Historical Averages Destroys Capital
- 2. The Mathematics of Marginal ROAS (mROAS) & Diminishing Returns Curves
- 3. The 70/20/10 Portfolio Capital Allocation Framework
- 4. Cross-Channel Capital Rebalancing Matrix: Google vs Meta vs YouTube vs B2B
- 5. Weekly Budget Pacing Governance & The 72-Hour Scaling Cadence
- 6. Production Python Optimization Script: Cross-Channel Budget Reallocator
- 7. Diagnosing Channel Saturation: Frequency, Search Impression Share & CPM Drift
- 8. Step-by-Step Monthly & Quarterly Capital Reallocation Playbook
- 10. The Adstock & Saturation Decay Function: Modeling Carryover Effects
- 11. Enterprise Capital Governance Dashboard: React & Tailwind UI Component
- 9. Frequently Asked Questions: Reallocating Media Spend Dynamically
- The Marginal Principle: Optimal portfolio capital allocation is achieved when the Marginal ROAS across all active channels is equalized ($mROAS_{ ext{Google}} = mROAS_{ ext{Meta}} = mROAS_{ ext{YouTube}}$). Shifting spend from a low-marginal channel to a high-marginal channel expands total company revenue with zero net increase in ad spend.
- The 70/20/10 Rule: Protect account stability by allocating 70% of total capital to Proven Core conversion channels, 20% to Scalable Growth levers with high ceiling potential, and 10% to High-Beta Experimental channels (new ad networks, influencer whitelisting, emerging AI search engines).
- Algorithmic Stability Guardrails: Ad networks enter disruptive "Learning Phases" if budgets swing wildly. Budget reallocations must be capped at $\le 20\%$ shifts every 72 hours per campaign to preserve bidding calibration.
- Automated Pacing Dashboards: Daily pacing tracking prevents the common end-of-month panic where accounts either run out of budget on day 22 or dump 30% of their budget in the final 5 days to hit arbitrary spend targets.
1. The Average ROAS Trap: Why Optimizing on Historical Averages Destroys Capital
Consider a standard enterprise brand spending $200,000 per month across Google Search and Meta Ads. A monthly performance report shows the following headline figures:
| Ad Channel | Monthly Spend | Reported Revenue | Average ROAS (aROAS) | Naive Reaction |
|---|---|---|---|---|
| Google Search (Brand + Generic) | $100,000 | $450,000 | 4.50x ROAS | "Google is crushing it! Shift $50k from Meta into Google immediately!" |
| Meta Ads (Prospecting + Retargeting) | $100,000 | $250,000 | 2.50x ROAS | "Meta is underperforming. Slash Meta budget by 50%!" |
The team follows this naive advice and reallocates $50,000 from Meta to Google Search. The result? Total company revenue drops by $85,000. Why? Because Google Search had already captured 92% of available commercial search impression share. The extra $50,000 was forced to bid on ultra-expensive, low-intent long-tail keywords where the marginal ROAS was only 0.80x. Meanwhile, cutting Meta spend choked off top-of-funnel customer discovery, causing organic and branded search volume to decline three weeks later.
2. The Mathematics of Marginal ROAS (mROAS) & Diminishing Returns Curves
In neoclassical microeconomics and media econometrics, performance functions as a logarithmic saturation curve governed by the Hill Equation:
Average ROAS vs Marginal ROAS Mathematical Distinction
Reflects the cumulative efficiency of all dollars spent from $0 up to current spend level. Highly backward-looking.
The expected return on the very next dollar invested. When $mROAS < ext{Break-Even Cost}$, any additional budget actively destroys enterprise profit.
3. The 70/20/10 Portfolio Capital Allocation Framework
To prevent over-concentration in saturated channels while continuously discovering new growth engines, enterprise performance marketing teams organize total media capital into the 70/20/10 Portfolio Framework:
| Portfolio Bucket | Capital Share | Strategic Mandate | Channel Examples | Evaluation Metric |
|---|---|---|---|---|
| 1. Proven Core Engine | 70% of Budget | Harvest high-intent demand; maintain predictable contribution profit. | Google Brand Search, Non-Brand Exact/Phrase, Meta Proven Winning Angles, Retargeting. | Target CPA / iROAS $\ge 3.0x$ |
| 2. Scalable Growth Levers | 20% of Budget | Expand market share; reach net new audiences before channel saturation. | YouTube Video View Campaigns (VVC), Broad Match Search with Smart Bidding, Meta Broad Prospecting. | mROAS $\ge 1.8x$; High Net New Customer % |
| 3. High-Beta Experiments | 10% of Budget | R&D innovation; test emerging networks and breakthrough creative formats. | TikTok Shop Ads, Reddit B2B targeting, Demand Gen carousels, Perplexity AI sponsored citations. | Cost per qualified learn / Early funnel CVR |
4. Cross-Channel Capital Rebalancing Matrix: Google vs Meta vs YouTube vs B2B
When rebalancing capital between distinct ad platforms, growth teams evaluate each channel against its specific position in the customer acquisition lifecycle:
Enterprise Cross-Channel Rebalancing Protocol
You are artificially capping high-intent search demand due to budget constraints. Reallocate capital from experimental or saturated prospecting tiers into Search until Search Lost IS (Budget) drops below 10%.
Meta creative is saturating your addressable audience. Reallocate 15% of Meta budget into YouTube Video View Campaigns (VVC) or new horizontal creative angles to seed fresh awareness.
Channels are cannibalizing each other's conversion credits. Immediately freeze retargeting spend, audit PMax brand exclusion lists, and run geo-holdout tests to identify the zero-incrementality channel.
5. Weekly Budget Pacing Governance & The 72-Hour Scaling Cadence
Uncontrolled budget shifts destabilize machine learning bidding algorithms. To maintain algorithmic equilibrium across Meta Ads and Google Smart Bidding, adhere to the 72-Hour Systematic Scaling Cadence:
- The 20% Budget Swing Ceiling: Never modify a campaign's daily budget by more than $\pm 20\%$ within any 72-hour window. A 40% budget jump forces Meta and Google ad sets into the "Learning Phase", causing volatility and CPM spikes.
- Daily Burn-Rate Pacing Monitoring: Track cumulative month-to-date spend against ideal linear pace. If an account is pacing at 115% on Day 10, execute a calibrated 5% budget trim rather than waiting until Day 25 to slash budgets by 50%.
- Conversion Latency Adjustment: For products with multi-day consideration cycles (e.g. 7-day average latency), never make budget reallocations based on the trailing 48 hours of data. Always evaluate performance on a 7-day or 14-day rolling window lagged by 3 days.
6. Production Python Optimization Script: Cross-Channel Budget Reallocator
Below is production Python code that ingests multi-channel performance data, fits a logarithmic diminishing returns curve to each channel, and computes the optimal budget reallocation to maximize total portfolio profit under a fixed total budget constraint:
import numpy as np
from scipy.optimize import minimize
from typing import Dict, List

# =====================================================================
# MEDIA PORTFOLIO CAPITAL ALLOCATION OPTIMIZER (mROAS EQUALIZATION)
# =====================================================================

class MediaBudgetOptimizer:
    def __init__(self, total_budget: float, channel_params: Dict[str, Dict[str, float]]):
        '''
        channel_params maps channel names to Hill / Logarithmic curve parameters:
        Revenue(Spend) = alpha * log(1 + beta * Spend)
        '''
        self.total_budget = total_budget
        self.channels = list(channel_params.keys())
        self.params = channel_params

    def channel_revenue(self, spend: float, channel: str) -> float:
        alpha = self.params[channel]['alpha']
        beta = self.params[channel]['beta']
        return alpha * np.log(1.0 + beta * spend)

    def marginal_roas(self, spend: float, channel: str) -> float:
        alpha = self.params[channel]['alpha']
        beta = self.params[channel]['beta']
        # Derivative: dR/dS = (alpha * beta) / (1 + beta * S)
        return (alpha * beta) / (1.0 + beta * spend)

    def optimize_allocation(self) -> Dict[str, Any]:
        n = len(self.channels)
        initial_guess = [self.total_budget / n] * n
        bounds = [(self.total_budget * 0.05, self.total_budget * 0.60) for _ in range(n)]

        def objective(spends):
            # Negative total revenue for minimization
            total_rev = sum(self.channel_revenue(spends[i], self.channels[i]) for i in range(n))
            return -total_rev

        constraints = ({'type': 'eq', 'fun': lambda spends: sum(spends) - self.total_budget})

        res = minimize(objective, initial_guess, method='SLSQP', bounds=bounds, constraints=constraints)

        results = {}
        for i, ch in enumerate(self.channels):
            opt_spend = round(res.x[i], 2)
            results[ch] = {
                "recommended_spend": opt_spend,
                "share_of_budget": f"{round((opt_spend / self.total_budget) * 100, 1)}%",
                "expected_revenue": round(self.channel_revenue(opt_spend, ch), 2),
                "terminal_marginal_roas": round(self.marginal_roas(opt_spend, ch), 2)
            }
        return results

# Production Run Example
if __name__ == "__main__":
    # Fitted econometric parameters from historical spend & lift data
    channels = {
        "Google_NonBrand_Search": {"alpha": 45000, "beta": 0.00012},
        "Meta_Broad_Prospecting": {"alpha": 65000, "beta": 0.00008},
        "YouTube_Video_Views":   {"alpha": 28000, "beta": 0.00018},
        "Google_PMax":           {"alpha": 50000, "beta": 0.00010}
    }

    optimizer = MediaBudgetOptimizer(total_budget=150000.0, channel_params=channels)
    plan = optimizer.optimize_allocation()
    print("Optimal Capital Allocation Plan Generated.")
Fitting Non-Linear Saturation Curves with SciPy & Empirical Data
In production media mix modeling, marketing analysts fit empirical spend and revenue data to the two-parameter Hill Saturation Function:
Where $K$ represents the half-saturation spend threshold (the dollar spend where the channel achieves 50% of its maximum potential revenue) and $\gamma$ represents the shape parameter (governing whether the response curve is S-shaped or strictly concave).
- Low Spend Regime (Spend < 0.5K): Channel operates in increasing marginal returns. Scaling budget accelerates efficiency.
- Optimal Operational Zone (0.5K ≤ Spend ≤ 1.2K): Channel operates near maximum contribution margin.
- Saturated Diminishing Regime (Spend > 1.5K): Marginal ROAS drops below unit cost. Every additional dollar destroys net capital.
7. Diagnosing Channel Saturation: Frequency, Search Impression Share & CPM Drift
Before cutting or scaling a channel, performance directors inspect these three quantitative diagnostic signals to determine whether performance shifts are caused by creative fatigue or true audience saturation:
| Diagnostic Metric | Healthy Range | Saturation Red Flag | Root Cause & Remediation |
|---|---|---|---|
| Meta 7-Day Frequency | 1.2 - 2.2 | > 3.0 | Audience exhausted. Deploy horizontal angle diversification or widen targeting. |
| Google Search Lost IS (Budget) | < 10% | > 25% | Campaign is severely underfunded. Reallocate spend into this campaign immediately. |
| Blended CPM Drift (30-day) | $\pm 15\%$ | > +40% increase | Auction competition or ad relevance drop. Refresh creative assets and check quality ranking. |
Channels do not operate in silos; they interact synergistically. Scaling top-of-funnel YouTube Video View Campaigns (VVC) or Meta Broad Prospecting creates an assisted lift in organic search queries and non-brand Google Ads CTR by up to 28%. When reallocating budget away from top-of-funnel channels, growth teams must apply a positive interaction modifier (β_{interaction}) to prevent inadvertent collapse of downstream conversion velocity. In practice, enterprise brands observe that every 10% reduction in upper-funnel video spend eventually induces a 4% to 7% drag on Google Brand Search impression volume within 21 days, proving that capital allocation must be governed as an interconnected multi-touch ecosystem where brand awareness directly lubricates transactional search capture.
8. Step-by-Step Monthly & Quarterly Capital Reallocation Playbook
Follow this disciplined operating cadence to manage cross-channel media budgets without disruption:
Review MTD spend pacing vs plan. Check Search Lost IS (Budget) and Meta 7-day frequencies. Make micro-adjustments ($\le 10\%$) to keep pacing aligned with monthly capital targets.
Calculate empirical marginal ROAS across all channels over trailing 30 days. Rebalance budgets between channels in accordance with the 70/20/10 rule. Graduate winning tests from the 10% experimental bucket into the 20% growth bucket.
Execute a 28-day geo-holdout experiment or Marketing Mix Model (MMM) run. Re-calibrate marginal efficiency curves and establish new channel baseline constraints for the upcoming quarter.
9. Frequently Asked Questions: Reallocating Media Spend Dynamically
Q1: Should we turn off an ad channel completely if its ROAS falls below our target?
Rarely. Before shutting off a channel entirely, trim its budget by 30%–50%. Because of diminishing marginal returns in reverse, cutting spend often causes the channel's marginal ROAS to recover back above your target threshold as it sheds its most expensive, least efficient auction inventory.
Q2: How do we handle sudden mid-month spend surpluses from under-delivering campaigns?
Do not dump unspent capital into other channels in a blind rush to hit spend quotas. If Cost Cap campaigns or search inventory under-delivers, bank the savings as profit. Force-spending capital into saturated auctions always destroys marginal ROAS.
Q3: How often should we update our 70/20/10 portfolio budget allocations?
Portfolio bucket percentages should be evaluated on a monthly basis, with formal strategic capital reallocations executed at the beginning of each fiscal quarter to allow experiments sufficient time to gather statistically significant data.
10. The Adstock & Saturation Decay Function: Modeling Carryover Effects
When reallocating media spend, media buyers must account for Adstock Decay: the reality that advertising impressions delivered today continue to influence purchase decisions over future days and weeks. In high-consideration B2B and luxury DTC, up to 45% of an ad's commercial impact occurs after the initial impression week.
The Geometric Adstock Mathematical Transformation
The cumulative effective advertising pressure ($A_t$) at time $t$ is calculated using the decay retention rate ($\lambda$):
Search Ads & Promotional Flash Sales. Immediate purchase decision; carryover effect dissipates within 72 hours.
Meta Video Prospecting & Social Feeds. Builds product conviction; carryover lingers for 2 to 3 weeks.
YouTube Video View Campaigns (VVC) & Connected TV. Deep brand equity; carryover persists for 6 to 10 weeks.
11. Enterprise Capital Governance Dashboard: React & Tailwind UI Component
Below is a responsive React component designed for growth executive dashboards, visualizing cross-channel budget pacing, marginal ROAS thresholds, and automated reallocation recommendations:
import React from 'react';
import { TrendingUp, AlertTriangle, ArrowRight, DollarSign } from 'lucide-react';

export const MediaReallocationDashboard = () => {
  const channels = [
    { name: 'Google Search Non-Brand', currentSpend: 45000, mROAS: 2.85, status: 'Scale +15%', color: 'text-emerald-400' },
    { name: 'Meta Broad Prospecting', currentSpend: 65000, mROAS: 2.40, status: 'Hold Optimal', color: 'text-cyan-400' },
    { name: 'YouTube Video Views (VVC)', currentSpend: 18000, mROAS: 3.10, status: 'Scale +20%', color: 'text-purple-400' },
    { name: 'Branded Search (Capped)', currentSpend: 22000, mROAS: 1.15, status: 'Trim -20%', color: 'text-amber-400' }
  ];

  return (
    <div className="rounded-2xl border border-slate-700 bg-slate-900 p-6 text-white shadow-xl">
      <div className="flex items-center justify-between border-b border-slate-700/60 pb-4 mb-4">
        <div>
          <h4 className="text-lg font-bold">Portfolio Capital Reallocation Engine</h4>
          <p className="text-xs text-slate-400">Equalizing Marginal ROAS Across Active Acquisition Channels</p>
        </div>
        <span className="rounded-full bg-emerald-500/20 px-3 py-1 text-xs font-semibold text-emerald-400">
          Algorithmic Pacing Active
        </span>
      </div>
      <div className="grid grid-cols-1 md:grid-cols-4 gap-4">
        {channels.map((ch, idx) => (
          <div key={idx} className="rounded-xl border border-slate-700/60 bg-slate-800/50 p-4">
            <div className="text-xs font-medium text-slate-400">{ch.name}</div>
            <div className="mt-2 text-xl font-black">${ch.currentSpend.toLocaleString()}</div>
            <div className="mt-1 flex items-center justify-between text-xs">
              <span className="text-slate-400">Marginal ROAS:</span>
              <span className="font-bold text-white">{ch.mROAS}x</span>
            </div>
            <div className={`mt-3 text-xs font-bold ${ch.color}`}>{ch.status}</div>
          </div>
        ))}
      </div>
    </div>
  );
};Maximize Portfolio Profit Across Every Paid Media Dollar
Escape the Average ROAS trap. Deploy marginal efficiency curves, the 70/20/10 portfolio allocation framework, and automated budget pacing to scale enterprise profit.