In performance marketing analytics, nothing creates more confusion between media buyers, data engineers, and executive leadership than the massive numerical disparity between advertising platform click reports and downstream Google Analytics 4 (GA4) sessions. A media buyer proudly reviews Meta Ads Manager or Google Ads and observes 10,000 Link Clicks at a stellar $1.20 CPC. However, when opening GA4 or the internal CRM, the analytics team logs only 6,800 Landing Page Sessions. Where did 3,200 clicks (and $3,840 in media budget) disappear to? The answer lies in the fundamental distinction between an outbound ad click, a verified Landing Page View (LPV), an engaged session, and downstream macro conversions. When media teams fail to measure and mathematically calculate their Landing Page View Rate (LPVR) alongside conversion rates, they optimize campaigns on phantom traffic signals. This quantitative masterclass breaks down the mathematical formulas, industry benchmarks, drop-off diagnostic methodologies, and micro-to-macro attribution models required to audit media traffic efficiency.
Table of Contents
- 1. The Core Formulas: CVR, LPVR & Click-to-Session Disparity
- 2. Industry Benchmarks: What Constitutes a Healthy LPVR?
- 3. Diagnosing Drop-Off: Slow TTFB, Redirect Chains & Ad Blocker Loss
- 4. Session Conversion Rate vs. User Conversion Rate in GA4
- 5. The Micro vs. Macro Conversion Rate Framework
- 6. Quantitative Audit Script: BigQuery SQL Funnel Calculator
- 7. The 5-Step LPVR Remediation & Recovery Checklist
- The Click-to-Session Leak: An ad click is merely a user tapping a hyperlink inside an app. A Landing Page View (LPV) occurs only when the landing page HTML downloads and fires the analytics tracking pixel. If LPVR drops below 80%, you are bleeding over 20% of your advertising budget to technical drop-off.
- Landing Page View Rate Formula:
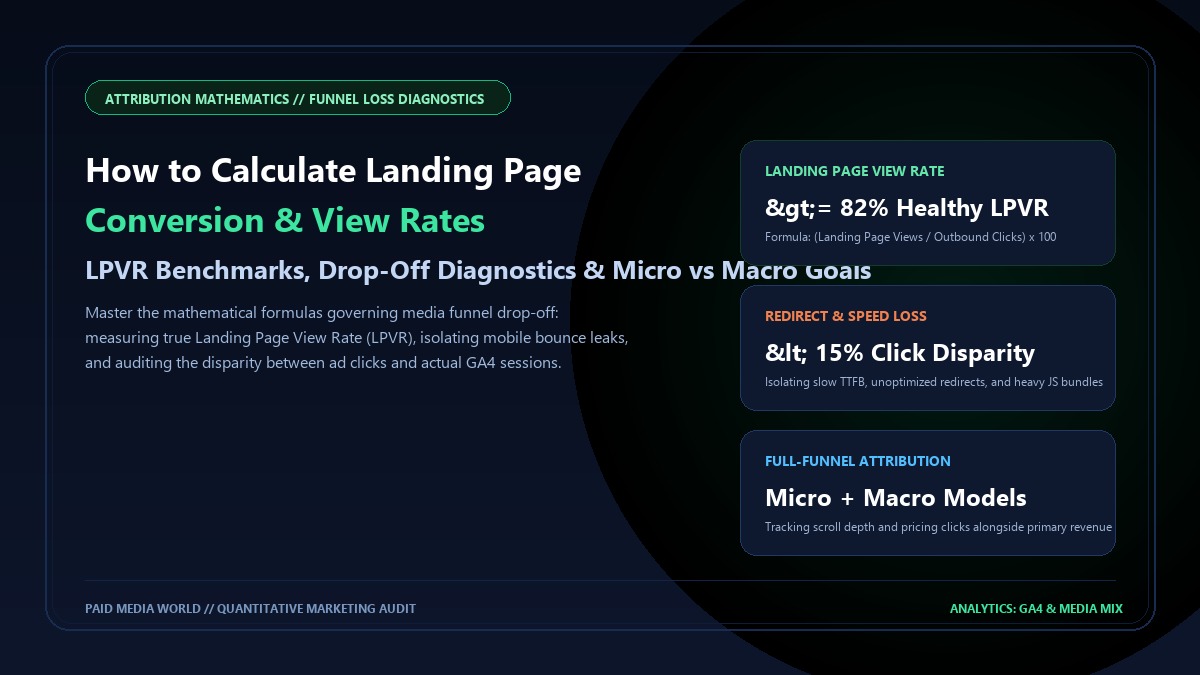
LPVR = (Landing Page Views / Outbound Clicks) × 100. On mobile Facebook/Instagram traffic, healthy benchmark LPVR ranges between 82% and 89%. Rates below 75% indicate severe latency or mobile rendering barriers. - Session CVR vs User CVR: In enterprise sales with multi-touch journeys, Session CVR artificially suppresses apparent conversion efficiency. Measuring User Conversion Rate provides true commercial cohort insight.
- Micro-Conversion Predictors: Evaluating landing page quality solely on macro conversions (purchases/leads) takes weeks on low-volume funnels. Measuring micro-conversions (scroll depth > 50%, time on site > 45s, interactive calculator engagement) provides immediate early indicator signals.
1. The Core Formulas: CVR, LPVR & Click-to-Session Disparity
To analyze traffic leakage, media buyers and marketing engineers must standardize four core equations across all reporting dashboards:
| Metric Name | Mathematical Formula | Healthy Benchmark | Primary Diagnostic Utility |
|---|---|---|---|
| Landing Page View Rate (LPVR) | (Verified LPVs / Outbound Clicks) × 100 | ≥ 82.0% | Detects slow loading, broken redirects, and accidental clicks. |
| Session Conversion Rate (sCVR) | (Total Conversions / Total Sessions) × 100 | 1.5% – 3.8% (eComm) / 2.5% – 6.0% (B2B) | Measures transactional page efficiency per site visit. |
| User Conversion Rate (uCVR) | (Unique Converting Users / Total Users) × 100 | 3.0% – 7.5% (High Intent) | Measures true customer acquisition efficiency across multi-visit cycles. |
| Click-to-Session Drop Rate (CSDR) | [(Ad Clicks - GA4 Sessions) / Ad Clicks] × 100 | ≤ 15.0% | Isolates tracking script failures, bot clicks, and latency bounces. |
2. Industry Benchmarks: What Constitutes a Healthy LPVR?
Landing Page View Rates vary considerably depending on traffic channel, device category, and geographic network conditions:
- Google Search (Desktop): 90% – 95% LPVR. Desktop users on high-speed fiber or corporate broadband rarely bounce before a landing page finishes rendering.
- Google Search (Mobile): 84% – 88% LPVR. Mobile search users have high commercial intent but exhibit impatience if initial paint exceeds 2 seconds.
- Meta Ads (Instagram / Facebook Mobile In-App Browser): 78% – 85% LPVR. Users browse in transient environments (commuting, in-transit). Accidental thumb-taps are common, leading to instant exits before the browser container opens.
- TikTok & Snapchat Ads: 68% – 78% LPVR. Fast-swiping younger demographics produce higher accidental click volumes. Any page taking over 1.5s to render experiences catastrophic drop-off.
3. Diagnosing Drop-Off: Slow TTFB, Redirect Chains & Ad Blocker Loss
If your LPVR falls below 80%, investigate these 4 primary technical culprits:
Directing ads to http://yourdomain.com which redirects to https://yourdomain.com and then redirects to https://www.yourdomain.com/landing/ adds 800ms to 1,500ms of DNS lookup latency. Every redirect hop sheds approximately 8% of mobile visitors.
Uncached monolithic CMS backends (unoptimized WordPress or legacy PHP) that require 1.2s just to generate the initial HTML response force mobile users to stare at a blank white screen, inducing immediate rage-exits.
Placing your Google Tag Manager or GA4 script below heavy render-blocking CSS and JavaScript bundles means a user who bounces at 2.5 seconds leaves before the tracking script ever executes, creating an unrecorded "ghost session."
Brave Browser, Safari ITP, and desktop ad-blocking extensions (uBlock Origin) block client-side Google Analytics requests outright. Implementing Server-Side Tagging (sGTM) recovers 12%–18% of these missing sessions.
4. Session Conversion Rate vs. User Conversion Rate in GA4
In Google Analytics 4, confusion often arises between Session Conversion Rate and User Conversion Rate:
- Session Conversion Rate: Calculated as `(Sessions with Conversion Event / Total Sessions) × 100`. Ideal for impulse DTC e-commerce where buying decisions occur on the initial visit.
- User Conversion Rate: Calculated as `(Users who Converted / Total Users) × 100`. Essential for high-consideration B2B SaaS, enterprise consulting, and high-ticket lead generation where an executive visits the landing page 3 times across 14 days before submitting a demo request. Evaluating high-ticket software on Session CVR makes campaigns appear 50% less effective than reality.
5. The Micro vs. Macro Conversion Rate Framework
When launching a new campaign, waiting for 50 macro purchases or demo bookings to calculate statistical significance can take weeks. Implement a hierarchical micro-conversion ladder to evaluate traffic engagement within the first 48 hours:
| Conversion Tier | Event Name in GA4 | Measurement Trigger | Target Health Ratio |
|---|---|---|---|
| Micro Tier 1: Attention Gate | scroll_50_percent | Visitor scrolls through at least 50% of page depth | ≥ 45% of LPVs |
| Micro Tier 2: Engagement Gate | time_on_page_45s | Active dwell time exceeding 45 seconds | ≥ 30% of LPVs |
| Micro Tier 3: High-Intent Action | pricing_view / calc_use | Clicks pricing modal or uses interactive calculator | ≥ 14% of LPVs |
| Macro Goal: Pipeline Capture | demo_booked / purchase | Qualified form submission or financial transaction | 2.5% – 5.5% of LPVs |
6. Quantitative Audit Script: BigQuery SQL Funnel Calculator
For enterprise marketing teams exporting raw GA4 events to Google BigQuery, execute this SQL query to calculate verified LPVR, Click-to-Session Disparity, and Session CVR by paid campaign:
WITH CampaignData AS (
  SELECT
    traffic_source.source AS utm_source,
    traffic_source.name AS utm_campaign,
    COUNT(DISTINCT user_pseudo_id) AS unique_users,
    COUNT(DISTINCT CONCAT(user_pseudo_id, CAST(event_timestamp AS STRING))) AS total_pageviews,
    COUNTIF(event_name = 'page_view') AS verified_lpvs,
    COUNTIF(event_name = 'user_engagement') AS engaged_sessions,
    COUNTIF(event_name = 'purchase' OR event_name = 'generate_lead') AS macro_conversions
  FROM
    `your-gcp-project.analytics_123456789.events_*`
  WHERE
    _TABLE_SUFFIX BETWEEN '20261001' AND '20261031'
    AND traffic_source.medium IN ('cpc', 'paid', 'paidsocial')
  GROUP BY
    utm_source, utm_campaign
)
SELECT
  utm_source,
  utm_campaign,
  unique_users,
  verified_lpvs,
  macro_conversions,
  -- Calculate Landing Page View to Conversion Rate
  ROUND((macro_conversions / NULLIF(verified_lpvs, 0)) * 100, 2) AS lp_cvr_percentage,
  -- Calculate User Conversion Rate
  ROUND((macro_conversions / NULLIF(unique_users, 0)) * 100, 2) AS user_cvr_percentage
FROM
  CampaignData
ORDER BY
  verified_lpvs DESC;
7. The 5-Step LPVR Remediation & Recovery Checklist
Audit Your Media Attribution & Funnel Drop-off
Paid Media World audits full-funnel media performance from ad click to verified bank account revenue. Uncover click leakage, diagnose slow landing page drop-offs, and reclaim lost ROAS.