Paid Media World

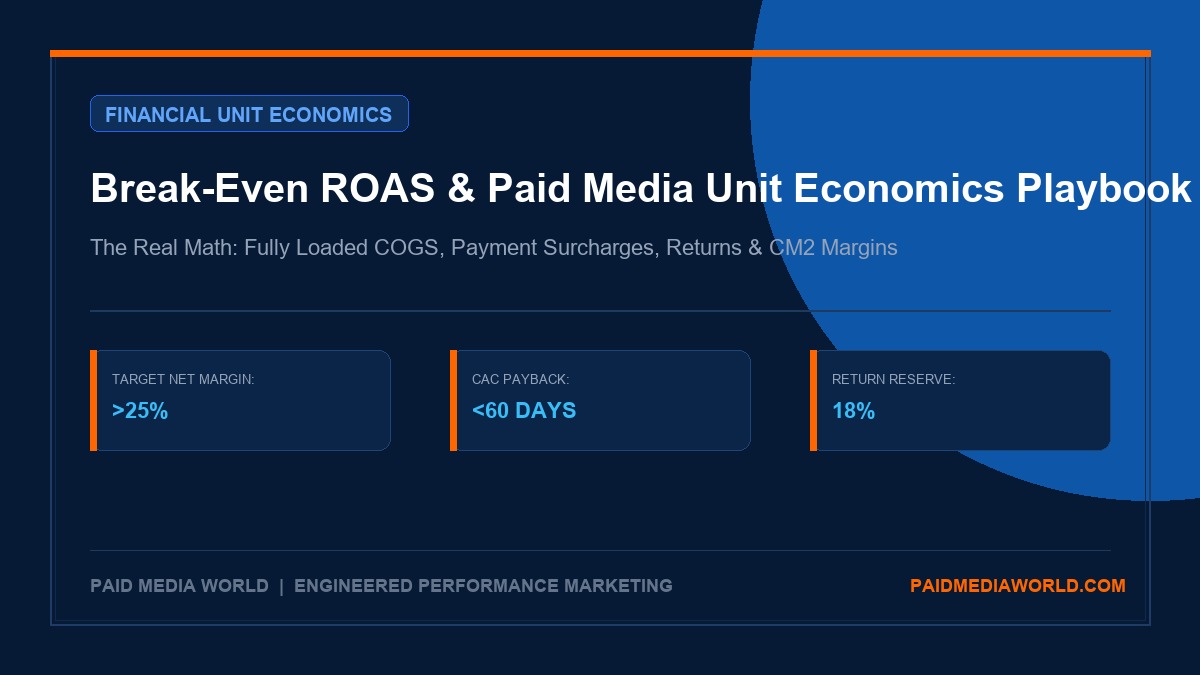
Break-Even ROAS and Paid Media Unit Economics: Mathematical Calculator Guide & Playbook

An engineering-grade financial playbook for calculating true break-even ROAS, contribution margins, allowable target CPA, and net profit economics across Meta a

SN
By Subhranil Naskar
|November 6, 2026|13 min read|Fact-Checked & Audited
Sponsored Technical Insights
break even roas paid media unit economics
# Break-Even ROAS and Paid Media Unit Economics: Mathematical Calculator Guide & Playbook In the high-growth phase of digital advertising, founders and media buyers frequently fall into a catastrophic financial trap: celebrating a **4.0x in-platform Return on Ad Spend (ROAS)** while the company's operational bank account steadily bleeds cash. The root cause is a fundamental misunderstanding of **paid media unit economics**. Standard dashboard ROAS measures only gross top-line revenue divided by ad spend (Revenue / Spend). It completely ignores manufacturing COGS, inbound ocean freight tariffs, payment gateway processing fees, pick/pack fulfillment surcharges, reverse logistics return allowances, and unallocated operating overhead. When fully loaded variable costs are factored in, an e-commerce brand operating on a 60% apparent gross margin often discovers that their true **Break-Even ROAS is 3.2x to 3.5x**, not the 1.67x (1 / 0.60) commonly quoted by agency pitch decks. Scaling at a 2.5x ROAS in that scenario does not build enterprise value—it accelerates bankruptcy. This guide establishes the definitive mathematical framework for calculating **Break-Even ROAS**, **Target CPA**, **Contribution Margin 1 & 2**, and **Profit On Ad Spend (POAS)**. ---

1. The "Top-Line ROAS" Mirage: Why 4.0x ROAS Can Bankrupt an E-Commerce Brand

Consider a direct-to-consumer apparel brand generating $100,000 in monthly revenue with an Average Order Value (AOV) of $100 across 1,000 orders. The agency dashboard reports: - **Ad Spend**: $25,000 - **Reported Revenue**: $100,000 - **Reported ROAS**: **4.0x** On surface metrics, this appears to be an exceptional campaign. However, let us examine the operational income statement: | Line Item | Percentage of AOV | Dollar Amount (Per $100 Order) | Monthly Total ($100k Rev) | | :--- | :--- | :--- | :--- | | **Gross Revenue** | 100.0% | $100.00 | $100,000 | | **Manufacturing Product COGS** | 30.0% | -$30.00 | -$30,000 | | **Inbound Freight & Customs Duties** | 8.0% | -$8.00 | -$8,000 | | **Payment Gateway Processing (2.9% + $0.30)** | 3.2% | -$3.20 | -$3,200 | | **3PL Pick, Pack & Packaging Materials** | 6.5% | -$6.50 | -$6,500 | | **Outbound Shipping (Subsidized)** | 9.0% | -$9.00 | -$9,000 | | **Return Reserve & Reverse Logistics (22% Return Rate)** | 11.5% | -$11.50 | -$11,500 | | **Customer Support Allocation** | 2.5% | -$2.50 | -$2,500 | | **Net Available Margin (Before Ad Spend)** | **29.3%** | **$29.30** | **$29,300** | | **Meta & Google Ad Spend** | 25.0% | -$25.00 | -$25,000 | | **Net Contribution Margin 2 (CM2)** | **4.3%** | **$4.30** | **$4,300** | | **Fixed Overhead (SaaS, Salaries, Rent, Accounting)** | 12.0% | -$12.00 | -$12,000 | | **Net Operational Profit / Loss (EBITDA)** | **-7.7%** | **-$7.70** | **-$7,700 (NET LOSS)** | Despite a glowing **4.0x ROAS**, the company loses **$7,700 every single month**. For every dollar of gross sales driven by paid media, the business burns cash because the media buying targets were set using naive gross margin rather than **fully loaded contribution economics**. Calculate your true unit economics in seconds using our [Free Marketing Calculators](/marketing-calculators/). ---

2. The True Break-Even ROAS Equation: Mathematical Formulation

To establish bid strategies that guarantee survival and capital growth, we must derive the exact mathematical break-even threshold: $$ ext{Net Pre-Ad Profit Margin (\%)} = 1 - rac{ ext{COGS} + ext{Fulfillment} + ext{Payment Fees} + ext{Shipping} + ext{Return Cost}}{ ext{AOV}}$$ $$ ext{Break-Even ROAS} = rac{1}{ ext{Net Pre-Ad Profit Margin (\%)}} = rac{ ext{AOV}}{ ext{AOV} - ext{Total Variable Operational Costs}}$$ ### Core Formula Derivation If a brand's total variable operational costs equal $70.70 on a $100 order: - Net Pre-Ad Margin = 1 - (70.70 / 100.00) = 0.293 (or 29.3%) - Break-Even ROAS = 1 / 0.293 = **3.41x** Operating at anything below a **3.41x ROAS** produces an immediate cash loss on the first transaction. ### Adding Desired Profit Margin To achieve a target bottom-line Contribution Margin of 15% on ad spend: $$ ext{Target ROAS} = rac{1}{ ext{Net Pre-Ad Margin} - ext{Target Profit Margin}} = rac{1}{0.293 - 0.150} = rac{1}{0.143} = \mathbf{6.99 imes}$$ ---

3. The 6 Layers of Fully Loaded Cost of Goods Sold (COGS)

Novice marketers define COGS purely as the factory invoice price. Enterprise financial controllers analyze **Fully Loaded Landed COGS**: ```text Fully Loaded Landed COGS ├── 1. Factory Production Cost (Raw materials, labor, factory markup) ├── 2. Primary Packaging (Custom boxes, bottles, tamper-evident seals) ├── 3. Inbound Freight (Ocean container, air cargo charter, rail drayage) ├── 4. Tariffs, Port Surcharges & Customs Brokerage (Section 301, HTS codes) ├── 5. Inbound 3PL Receiving & Pallet De-stuffing (Per-pallet check-in fees) └── 6. Production Scrap & Quality Assurance Loss (Typical 2%–4% defect allowance) ``` If factory cost is $20.00, but packaging is $2.50, international ocean freight is $4.00, tariffs are $3.20, inbound receiving is $0.80, and scrap rate is $0.50, the **true landed COGS is $31.00**—a **55% increase** over the raw invoice figure. ---

4. Variable Friction Modeling: Gateways, 3PL Fulfillment & Shipping Surcharges

Variable friction represents the costs triggered exclusively when an order is authorized, packaged, and dispatched. ### 1. Payment Gateway Realities Credit card processors do not charge a flat 2.9%. The blended reality across merchant accounts: - Domestic Visa/Mastercard: 2.1% to 2.4% + $0.25 - International Cards & Amex: 3.5% + $0.30 - Buy Now Pay Later (Klarna, Afterpay, Affirm): 5.9% + $0.30 - Chargeback Insurance & Dispute Fees: 0.4% blended reserve - **Effective Blended Processing Rate**: **3.2% to 4.1% of gross checkout value** ### 2. Warehousing & 3PL Pick/Pack - Base Pick/Pack: $3.50 for the first item + $0.75 for each additional unit. - Shipping Boxes & Tissue Paper: $1.20 per parcel. - Monthly Storage Allocation: $0.60 per unit sold based on turn velocity. ### 3. Outbound Carrier Shipping Subsidies Customers expect free shipping above certain thresholds ($50 or $75). If actual carrier charges (USPS Ground Advantage, UPS SurePost, FedEx Home Delivery) average $9.20 per package, and the merchant charges $0 to the buyer, that **$9.20 is a direct 100% deduction from gross margin**. ---

5. The Sizing & Returns Trap: Modeling Return Reserves & Reverse Logistics

In e-commerce categories such as apparel, footwear, and consumer electronics, return rates range from **18% to 35%**. Ignoring returns when calculating break-even ROAS guarantees inaccurate financial modeling. ```mermaid graph TD A["Customer Orders $100 Jacket"] --> B{"Is Item Kept?"} B -->|"75% Kept"| C["Full Revenue Retained ($100)"] B -->|"25% Returned"| D["Revenue Refunded (-$100)"] D --> E["Outbound Shipping Lost (-$9.00)"] D --> F["Return Shipping Label Paid (-$8.50)"] D --> G["3PL Restocking & Inspection (-$4.00)"] D --> H["Damaged Packaging / Minor Blemish (-$5.00)"] D --> I["Total Net Loss on Returned Order: -$26.50"] ``` ### The Return Drag Formula: $$ ext{Return Cost Per Order} = ext{Return Rate} imes \left( ext{Outbound Ship} + ext{Return Label} + ext{Restock Fee} + ext{Refurbish Defect Rate} ight)$$ For a brand with a 22% return rate and an average reverse logistics cost of $22.50 per return: Return Drag = 0.22 * $22.50 = **$4.95 per initial order**. This $4.95 variable cost must be added directly into your variable cost stack before calculating target ROAS. ---

6. SKU-by-SKU Margin Decomposition: Low vs High AOV Unit Economics Case Study

To demonstrate how basket size transforms operational break-even metrics, consider three real-world e-commerce product profiles: | Financial Metric | Profile A: Low AOV ($38) | Profile B: Mid AOV ($95) | Profile C: High AOV ($240) | | :--- | :--- | :--- | :--- | | **Gross Order Value** | $38.00 | $95.00 | $240.00 | | **Landed Product COGS** | -$12.00 (31.5%) | -$26.00 (27.4%) | -$58.00 (24.2%) | | **Payment Gateway (Blended 3.4%)** | -$1.59 | -$3.53 | -$8.46 | | **Pick, Pack & Box** | -$4.80 | -$5.50 | -$7.20 | | **Outbound Carrier Shipping** | -$7.50 | -$8.80 | -$12.50 | | **Return Drag Reserve** | -$1.20 (8% Return) | -$4.75 (18% Return) | -$14.40 (22% Return) | | **Customer Support Allocation** | -$1.00 | -$2.00 | -$4.00 | | **Total Variable Cost** | -$28.09 (73.9%) | -$50.58 (53.2%) | -$104.56 (43.6%) | | **Net Pre-Ad Margin ($)** | **$9.91** | **$44.42** | **$135.44** | | **Net Pre-Ad Margin (%)** | **26.1%** | **46.8%** | **56.4%** | | **True Break-Even ROAS** | **3.83x** | **2.14x** | **1.77x** | | **Maximum Allowable CPA** | **$9.91** | **$44.42** | **$135.44** | ### Critical Takeaways for Media Buyers: 1. **Low AOV Vulnerability**: Profile A ($38 AOV) requires a staggering **3.83x ROAS** just to avoid losing cash because fixed fulfillment and parcel postage consume nearly 33% of total revenue. 2. **High AOV Breathing Room**: Profile C ($240 AOV) can scale profitably at a **1.77x ROAS**, granting massive auction headroom to outbid competitors on Google Search and Meta Ads. 3. **The Bundle Imperative**: If you sell low-ticket SKUs, enforce threshold-based bundling ("Buy 2 Get 1 Free" or "Free Shipping Over $65") to lift AOV into the $75+ sweet spot. ---

7. Contribution Margin 1 (CM1) vs Contribution Margin 2 (CM2) vs EBITDA

Financial health requires separating contribution into distinct structural tiers: ```text Net Revenue (Gross Sales minus Discounts & Returns) │ ├── [Less: Landed Product COGS] ▼ Gross Margin (Contribution Margin 0) │ ├── [Less: Variable Fulfillment, Shipping, Gateway Fees, Customer Support] ▼ Contribution Margin 1 (CM1) ──► Cash generated by product unit economics before marketing │ ├── [Less: Direct Paid Media Spend (Meta, Google, TikTok, Amazon Ads)] ▼ Contribution Margin 2 (CM2) ──► Net Cash generated to service company overhead │ ├── [Less: Fixed Overhead (Salaries, Rent, SaaS, Legal, Insurance, Agency Retainers)] ▼ Operating Income (EBITDA) ────► True Net Company Profitability ``` - **Target CM1 Benchmark**: $\ge 60\%$ of gross revenue. - **Target CM2 Benchmark**: $\ge 20\%$ to $28\%$ of gross revenue during active scaling. - If CM2 drops below **15%**, any unexpected macro volatility (CPMs surging, supply chain delays, chargeback spikes) will plunge the company into negative cash flow. ---

8. Target CPA Calculation: Deriving Allowable Acquisition Cost from Gross Margin

Once your unit economics are locked, derive the **Maximum Allowable CPA (Break-Even CPA)** and **Target CPA**: $$ ext{Break-Even CPA} = ext{AOV} - ext{Total Variable Operational Costs}$$ Using our earlier $100 AOV example where variable costs equal $70.70: Break-Even CPA = $100.00 - $70.70 = **$29.30**. If your media buyer spends $35.00 to acquire a customer on Meta, the business loses $5.70 on that transaction. ### Setting the Production Target CPA: $$ ext{Target CPA} = ext{Break-Even CPA} imes (1 - ext{Target Profit Margin on AOV})$$ If you require a 10% net profit margin on gross sales ($10 per order): Target CPA = $29.30 - $10.00 = **$19.30**. This deterministic figure ($19.30) becomes the strict threshold for setting **Cost Caps** or **Target CPA** bids inside Meta Ads Manager and Google Ads. ---

9. Blended Marketing Efficiency Ratio (MER) vs Profit On Ad Spend (POAS)

While in-platform ROAS is plagued by attribution bias and pixel leakage, enterprise brand operators steer scaling decisions using two macro indicators: ### 1. Marketing Efficiency Ratio (MER) $$ ext{MER} = rac{ ext{Total Net Store Revenue (Shopify)}}{ ext{Total Ad Spend Across All Channels}}$$ - **Benchmark**: An MER of **4.0x to 5.5x** indicates healthy, profitable scaling. - **Advantage**: Immune to cross-channel double-counting between Meta and Google. ### 2. Profit On Ad Spend (POAS) $$ ext{POAS} = rac{ ext{Gross Profit Generated}}{ ext{Total Ad Spend}} = rac{ ext{Net Revenue} - ext{COGS} - ext{Variable Fulfillment}}{ ext{Total Ad Spend}}$$ - If **POAS $> 1.0$**: Paid media is generating net cash beyond covering all product and fulfillment costs. - If **POAS $< 1.0$**: Paid media is actively eroding working capital. - **Scale Target**: Maintain a POAS between **1.35x and 1.80x** during aggressive acquisition sprints. ---

10. Cash Conversion Cycle (CCC) & Working Capital Impact on Ad Scaling

Scaling ad spend without modeling working capital velocity creates severe cash flow crunches: $$ ext{Cash Conversion Cycle (Days)} = ext{Days Inventory Outstanding (DIO)} + ext{Days Sales Outstanding (DSO)} - ext{Days Payables Outstanding (DPO)}$$ ### The Working Capital Trap in Paid Acquisition: 1. **Ad Spend Settles in 48 Hours**: American Express or credit card lines charge daily or weekly. 2. **Shopify/Stripe Payouts Take 2 to 4 Days**: Funds hit merchant accounts with slight delay. 3. **Inventory Reorders Require 30% Down**: If media buyers double ad spend to $100k/month, product sells out in 3 weeks, requiring immediate $60k wire transfers to manufacturing facilities 60 days before the replacement inventory arrives. 4. **Conclusion**: Never scale ad spend faster than your **Gross Margin Recovery Velocity**. If supplier payment terms are tight (100% upfront), maintain a cash reserve equivalent to **2.5x monthly ad spend**. ---

11. 7-Step Forensic Unit Economics Audit SOP for E-Commerce CFOs

Follow this weekly procedural SOP before approving agency budget increases: ```text Step 1: Extract Net Delivered Sales from ERP/Shopify (Subtracting cancellations and refunds) Step 2: Pull exact landed COGS from Inventory Management System (Katana, Unleashed, Cin7) Step 3: Reconcile Merchant Processing Fees from Stripe, PayPal, and Klarna statements Step 4: Pull 3PL carrier and outbound freight invoices for the exact cohort period Step 5: Calculate Return Drag: (Returned Units * Reverse Freight & Restock) / Initial Units Step 6: Compute CM1: Net Delivered Sales - (COGS + Processing + Shipping + Returns) Step 7: Compare Total Ad Spend vs CM1: If CM1 / Ad Spend < 1.35x, FREEZE SCALING ``` ---

12. Python Financial Model: Order-Level Contribution Margin Simulation

The following production Python script simulates order-level unit economics, generating exact Break-Even ROAS, Maximum Allowable CPA, and Contribution Margin 2 curves: ```python def calculate_unit_economics( aov: float, factory_cogs: float, inbound_freight_pct: float, gateway_pct: float, gateway_fixed: float, fulfillment_pick_pack: float, shipping_subsidy: float, return_rate_pct: float, avg_reverse_cost: float, support_cost: float, target_cm2_pct: float ): # 1. Total Landed COGS landed_cogs = factory_cogs + (aov * inbound_freight_pct) # 2. Variable Processing & Shipping payment_fee = (aov * gateway_pct) + gateway_fixed shipping_total = fulfillment_pick_pack + shipping_subsidy # 3. Return Reserve Allowance return_reserve = return_rate_pct * avg_reverse_cost # 4. Total Variable Operational Friction total_variable = landed_cogs + payment_fee + shipping_total + return_reserve + support_cost # 5. Net Pre-Ad Margin pre_ad_margin_dollars = aov - total_variable pre_ad_margin_pct = pre_ad_margin_dollars / aov # 6. Break-Even Metrics break_even_roas = 1.0 / pre_ad_margin_pct if pre_ad_margin_pct > 0 else float('inf') break_even_cpa = pre_ad_margin_dollars # 7. Target Scaling Metrics target_margin_dollars = aov * target_cm2_pct target_cpa = break_even_cpa - target_margin_dollars target_roas = aov / target_cpa if target_cpa > 0 else float('inf') return { "AOV": aov, "Total Variable Costs": round(total_variable, 2), "Pre-Ad Margin ($)": round(pre_ad_margin_dollars, 2), "Pre-Ad Margin (%)": f"{round(pre_ad_margin_pct * 100, 2)}%", "Break-Even ROAS": f"{round(break_even_roas, 2)}x", "Break-Even CPA ($)": round(break_even_cpa, 2), "Target CPA ($)": round(target_cpa, 2), "Target ROAS": f"{round(target_roas, 2)}x" } # Execute baseline e-commerce run results = calculate_unit_economics( aov=100.0, factory_cogs=30.0, inbound_freight_pct=0.08, gateway_pct=0.029, gateway_fixed=0.30, fulfillment_pick_pack=6.50, shipping_subsidy=9.00, return_rate_pct=0.22, avg_reverse_cost=22.50, support_cost=2.50, target_cm2_pct=0.10 # Target 10% net profit ) for k, v in results.items(): print(f"{k:25}: {v}") ``` ---

13. Frequently Asked Questions (FAQ)
### Why does my financial accountant report a different break-even ROAS than my agency? Most marketing agencies calculate break-even ROAS as 1 / Gross Margin Percentage using factory product cost alone. Your accountant calculates financial break-even based on **Fully Loaded Contribution Margin 1**, incorporating merchant fees, outbound freight, reverse logistics, and packaging. Always align media buying thresholds to the accountant's fully loaded model. ### How does Average Order Value (AOV) impact break-even ROAS? Because fulfillment pick/pack ($6.50) and fixed gateway fees ($0.30) are relatively constant regardless of basket size, **higher AOVs dramatically lower your break-even ROAS**. An order of $180 typically achieves a break-even ROAS of 2.1x, whereas a $35 order may require a 4.8x break-even ROAS to cover fixed parcel handling costs. ### Should I optimize for in-platform ROAS or POAS? Optimize media buying targeting and creative iterations using in-platform ROAS and Cost Caps, but govern **budget allocation and cross-channel scaling decisions using POAS (Profit On Ad Spend)**. If POAS is $> 1.4x$, you have verified mathematical room to scale budgets by up to 20% every 72 hours. ### What is a healthy Contribution Margin 2 (CM2) target for a scaling D2C brand? For brands under $5M annual run rate, target a **CM2 of 20% to 25%**. For brands prioritizing hyper-growth with strong 90-day repeat purchase LTV, CM2 can safely compress to **10% to 15%**, provided payback period on CAC is achieved within 60 days. --- *Need an engineered financial audit of your paid media ad accounts? Explore our analytical [Paid Media Services](/services/) or review our [Case Studies](/case-studies/) to see how we scale brands for net contribution margin.*
SN

Subhranil Naskar

Founder & Lead Performance Strategist
Kolkata, West Bengal, India

Subhranil is the Founder and Lead Performance Strategist at Paid Media World. With over 10 years of practitioner experience managing high-budget performance marketing infrastructure across Google Ads, Meta Ads (CAPI), and GA4 event attribution, he personally architects and audits deterministic paid media infrastructure, algorithmic portfolio bidding, and enterprise conversion architecture.

Recommended Deep Dives

Related Playbooks & Further Reading

Explore All Playbooks
Sponsored Recommendations