
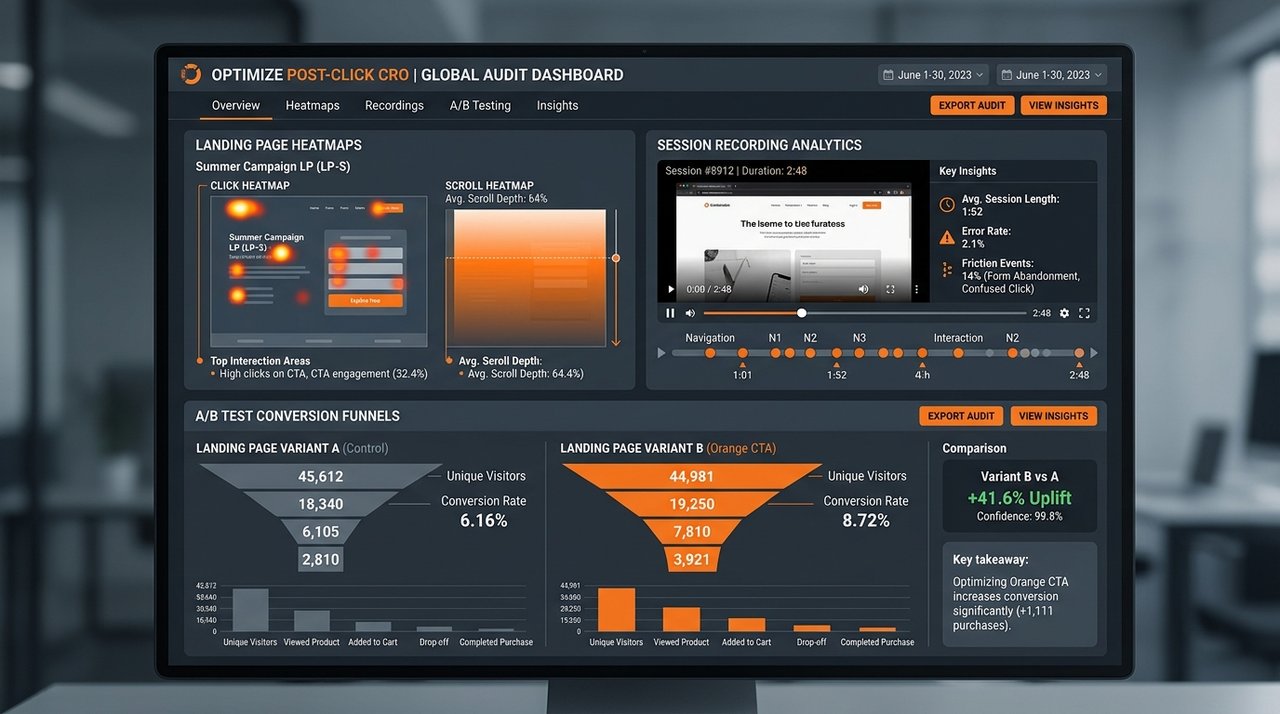
Media buyers routinely spend dozens of hours tweaking target CPA bids and testing creative hooks, while leaving their destination landing pages entirely unmonitored. Even a modest 0.5% lift in post-click conversion rate often cuts blended customer acquisition cost (CAC) more dramatically than a 20% drop in cost-per-click. A structured post click cro audit checklist ecommerce saas framework systematically uncovers where friction, cognitive overload, and checkout latency drain paid traffic budgets. In this step-by-step optimization manual, learn how to diagnose funnel drop-off, analyze heatmaps, and implement high-converting landing page architectures.
Table of Contents
- 1. Quantitative Audit: GA4 Funnel Exploration & Drop-off Analysis
- 2. Qualitative Audit: Microsoft Clarity Heatmaps & Rage Click Analytics
- 3. Mobile UX Friction Reduction: Sticky CTAs & 1-Click Payments
- 4. B2B & SaaS Form Field Optimization Architecture
- 5. Post-Click CRO Audit Master Checklist Matrix Table
- 6. A/B Test Prioritization: ICE vs. PIE Frameworks
- 7. Statistical Significance Math & Sample Size Calculations
- 8. Frequently Asked Questions
1. Quantitative Audit: GA4 Funnel Exploration & Drop-off Analysis
Start your CRO audit by mapping hard user drop-off metrics using GA4 Funnel Exploration reports. Build a step-by-step custom funnel mapping user progression from initial landing page view to conversion completion:
Step 1: Session Start ➔ `first_visit`
Step 2: Product Page View ➔ `view_item` (Typical Drop-off: 40–50%)
Step 3: Add to Cart ➔ `add_to_cart` (Typical Drop-off: 65–75%)
Step 4: Begin Checkout ➔ `begin_checkout` (Typical Drop-off: 35–45%)
Step 5: Purchase Complete ➔ `purchase`
Identifying the exact funnel step exhibiting abnormal drop-off pinpoints where technical or cognitive friction resides.
2. Qualitative Audit: Microsoft Clarity Heatmaps & Rage Click Analytics
While GA4 reveals where users drop off, qualitative session recordings and heatmaps reveal why users leave. Install free analytics tools like Microsoft Clarity or Hotjar to capture user behavior:
- Rage Clicks: Indicates users clicking repeatedly on non-clickable visual elements (e.g., static badges or un-linked product icons). Fix rage clicks by making elements interactive or removing false visual cues.
- Dead Clicks: Pinpoints broken JavaScript buttons or un-responsive CTA links.
- Scroll Depth Heatmaps: Reveals how far down the page users scroll. If critical value propositions sit below 50% scroll depth on mobile screens, move value props above the fold.
3. Mobile UX Friction Reduction: Sticky CTAs & 1-Click Payments
Over 70% of paid social ad traffic (Meta, TikTok, Instagram) arrives via mobile devices. Optimizing mobile landing page UX yields immediate conversion lift:
- Persistent Sticky Add to Cart / Demo CTA: Implement a fixed sticky bar at the bottom of mobile screens that remains visible as users scroll.
- 1-Click Mobile Digital Wallets: Enable Apple Pay, Google Pay, and Shop Pay single-click checkout options to eliminate 6-step manual credit card input forms.
- Eliminate Heavy Above-the-Fold Banners: Ensure key product headlines, pricing, and main CTA button render within the top 600px mobile viewport without scrolling.
4. B2B & SaaS Form Field Optimization Architecture
For B2B SaaS and lead generation sites, form field length directly dictates conversion rates. Every extra form field added reduces conversion volume by 8% to 11%.
2-Step Multi-Step Micro-Form Architecture
Replace long 8-field single-page forms with an interactive 2-Step Multi-Step Form:
Step 1 (Micro-Commitment): Select Company Size & Primary Goal ──▶ Click “Next”
Step 2 (Contact Info): Enter Work Email & Phone ──▶ Click “Get Demo”
Breaking forms into micro-commitments reduces psychological intimidation, raising form completion rates by 30%+.
5. Post-Click CRO Audit Master Checklist Matrix Table
| Audit Domain | Key Diagnostic Test | Target Benchmark | Potential Conversion Uplift |
|---|---|---|---|
| Page Speed & Technical | Mobile Largest Contentful Paint (LCP) | LCP < 2.2 seconds | +15% to +25% CVR Lift |
| Above-the-Fold Value Prop | H1 Message Match vs. Paid Ad Copy | 100% Headline Consistency | +20% Bounce Rate Reduction |
| Social Proof & Trust | UGC Review Stars & Media Logos near CTA | Visible above the fold | +18% Trust Uplift |
| Checkout / Form UX | 1-Click Apple Pay / Shop Pay Wallets | Available on mobile checkout | +30% Mobile CVR Lift |
6. A/B Test Prioritization: ICE vs. PIE Frameworks
Avoid launching arbitrary A/B test variations without strategic prioritization. Rank proposed CRO experiments using the ICE Prioritization Framework:
$$ ext{ICE Score} = rac{ ext{Impact (1-10)} + ext{Confidence (1-10)} + ext{Ease of Implementation (1-10)}}{3}$$
Focus your engineering resources strictly on hypothesis experiments scoring 8.0 or higher in your testing roadmap.
7. Statistical Significance Math & Sample Size Calculations
To avoid declaring false positive winners during A/B split testing, calculate required sample sizes before concluding experiments. Ensure test variations achieve a minimum of 95% Statistical Significance ($p < 0.05$) and 350+ conversions per variation.
8. Frequently Asked Questions
How do I perform a post click cro audit checklist ecommerce saas audit?
Audit post-click conversion rates by analyzing GA4 funnel drop-offs, capturing Microsoft Clarity heatmaps, eliminating mobile UX friction, optimizing form field lengths, and prioritizing A/B tests using ICE scoring.
What is a good conversion rate for e-commerce landing pages?
A healthy e-commerce landing page conversion rate typically ranges between 2.5% and 5.0%, depending on product price point and traffic source.
What is the difference between pre-click and post-click optimization?
Pre-click optimization focuses on ad copy, keywords, targeting, and CTR inside ad platforms. Post-click optimization focuses on landing page UX, page speed, value messaging, and checkout conversion rates.
How long should an A/B split test run?
Run A/B tests for a minimum of 2 full business cycles (14 to 21 days) to account for day-of-week traffic variations, ensuring at least 350 conversions per variation.
Why is mobile conversion rate lower than desktop conversion rate?
Mobile CVR is lower due to small screen sizes, slow page load speeds on cellular networks, cumbersome manual form fields, and distracting push notifications.
How does page load speed affect landing page conversion rates?
Every 1-second delay in mobile page load speed reduces conversion rates by up to 7%. Keeping mobile LCP under 2.0s prevents bounce drop-offs.
What is a rage click in heatmap analytics?
A rage click occurs when a user repeatedly clicks an un-responsive element, signaling user confusion or broken JavaScript functionality.
Should I remove navigation header links on paid landing pages?
Yes. Removing top navigation menus on dedicated paid landing pages keeps users focused on the primary CTA, increasing conversion rates by 15% to 30%.
What is the impact of free shipping thresholds on e-commerce AOV and CVR?
Displaying a dynamic progress bar (e.g., “Add $15 more for Free Shipping!”) increases Average Order Value while boosting checkout completion rates.
Can micro-copy adjustments improve form conversion rates?
Yes. Adding small reassuring micro-copy under CTA buttons (e.g., “No credit card required” or “Free 14-day trial”) reduces user anxiety and boosts clicks.
Advanced Form Field Analytics Script for Event Tracking
Track field-by-field form abandonment in GA4 using GTM to identify the exact form input field causing user drop-off:
document.querySelectorAll('form input, form select').forEach(function(element) {
  element.addEventListener('focus', function() {
    window.dataLayer = window.dataLayer || [];
    window.dataLayer.push({
      'event': 'form_field_focus',
      'field_name': element.name || element.id
    });
  });
});
Integrating Automated Visual Regression Testing
Use visual regression testing tools (such as Percy or Playwright) during landing page code updates to prevent accidental layout shifts or hidden CTA buttons across mobile devices.
Auditing Cognitive Friction & Value Proposition Clarity Above the Fold
When high-intent ad traffic lands on a web page, users decide within 3 seconds whether to stay or bounce. Evaluate your above-the-fold real estate against the 5-second clarity test:
- Clear H1 Headline Match: Does the primary headline mirror the exact promise made in the paid search ad or paid social creative?
- Sub-Headline Value Clarification: Does the sub-headline explain who the product is for and what unique benefit it delivers without corporate jargon?
- Primary CTA Visual Contrast: Is the main call-to-action button rendered in a high-contrast brand color that stands out instantly from background containers?
Mobile Page Speed & Cumulative Layout Shift (CLS) Optimization
Unstable page layouts cause accidental mis-clicks on mobile devices, driving user frustration and immediate bounce spikes. Eliminate Cumulative Layout Shift (CLS) by assigning explicit aspect ratio height and width attributes to hero images and embedded video containers:
<!-- Prevent CLS by Declaring Explicit Image Dimensions -->
<img src="hero-product.webp" alt="Product Demo" width="1280" height="720" style="width:100\%; height:auto;">
Keeping mobile CLS below 0.1 ensures stable page rendering, preserving user trust and conversion momentum.
Troubleshooting Low A/B Split Test Statistical Power
If an active A/B split test runs for 3 weeks without reaching 95% statistical significance ($p < 0.05$), execute the following diagnostic checklist:
- Check Test Variation Impact: Testing minor button color tweaks rarely yields statistically significant conversion uplift. Shift testing focus to high-impact macro changes (e.g., completely restructuring the value proposition or changing headline hooks).
- Increase Traffic Allocation: Verify that traffic is split 50/50 between Control and Variation without traffic throttling rules.
- Consolidate Micro-Goals: Ensure your primary test goal tracks high-volume macro conversion events (e.g., `completed_purchases` or `demo_requests`).
How does dynamic content personalization affect landing page conversion rates?
Dynamic Content Personalization (DCP) swaps landing page headlines and hero images based on URL query parameters (e.g., matching headline text to specific Google Ads search keywords), lifting conversion rates by 25%+.
What is the recommended number of form fields for B2B demo pages?
Limit initial form fields to 3 or 4 inputs (Work Email, First Name, Company Name, Team Size) to maximize completion velocity.
Automating A/B Test Variant Deployment via Feature Flag Orchestration
For enterprise SaaS engineering teams managing high-volume landing page experiments, deploy A/B test variations using server-side Feature Flags (such as LaunchDarkly or Flagsmith) to eliminate client-side JavaScript flicker:
// Server-Side Node.js Feature Flag A/B Test Router
const LaunchDarkly = require('launchdarkly-node-server-sdk');
const client = LaunchDarkly.init('YOUR_SDK_KEY');

async function renderLandingPage(req, res) {
  const user = { key: req.session.id, custom: { traffic_source: req.query.utm_source } };
  const showNewFormVariant = await client.variation('cro-2step-form-experiment', user, false);

  if (showNewFormVariant) {
    res.render('landing_page_variant_b');
  } else {
    res.render('landing_page_control');
  }
}
Optimizing Social Proof & Micro-Copy Triggers for High-Ticket Services
For high-ticket B2B service offerings (e.g., $10k+/month performance media retainers), generic review badges fail to establish trustworthiness. Engineer high-impact Social Proof Triggers directly adjacent to primary CTA buttons:
- Quantified Impact Metrics: Replace static “Trusted by Businesses” headers with specific quantified metrics: “Engineered $42M+ in Verified Paid Media Revenue for 120+ B2B Brands.”
- Recognizable Enterprise Client Logos: Embed monochromatic client logos immediately below primary form buttons.
- Third-Party Verification Badges: Display G2 Crowd Leader badges, Google Premier Partner seals, and SOC 2 Type II compliance trust seals in your page footer.
Mastering these quantitative and qualitative CRO workflows transforms your paid acquisition engine into a scalable, high-ROAS revenue center.
Conclusion
Executing a post click cro audit checklist ecommerce saas framework transforms paid ad traffic into predictable revenue. Systematically eliminating landing page friction ensures every dollar spent on paid acquisition delivers maximum business growth.
Need expert assistance auditing your landing pages or building high-converting A/B split tests? Schedule a CRO audit with our performance engineering team today.