
Ask any DTC brand founder or B2B growth leader what their return on ad spend (ROAS) is, and they will likely give you three conflicting numbers. Meta Ads Manager claims a 4.2x ROAS. Google Ads reports a 5.1x ROAS. Yet their Shopify or Stripe merchant payout ledger indicates the company is barely operating at break-even.
This discrepancy is known across performance marketing as The Attribution Fallacy. Every self-attributing network (SAN) takes full credit for purchases that occurred across multi-touch customer journeys. When media buyers manage campaigns in channel silos, they fly blind.
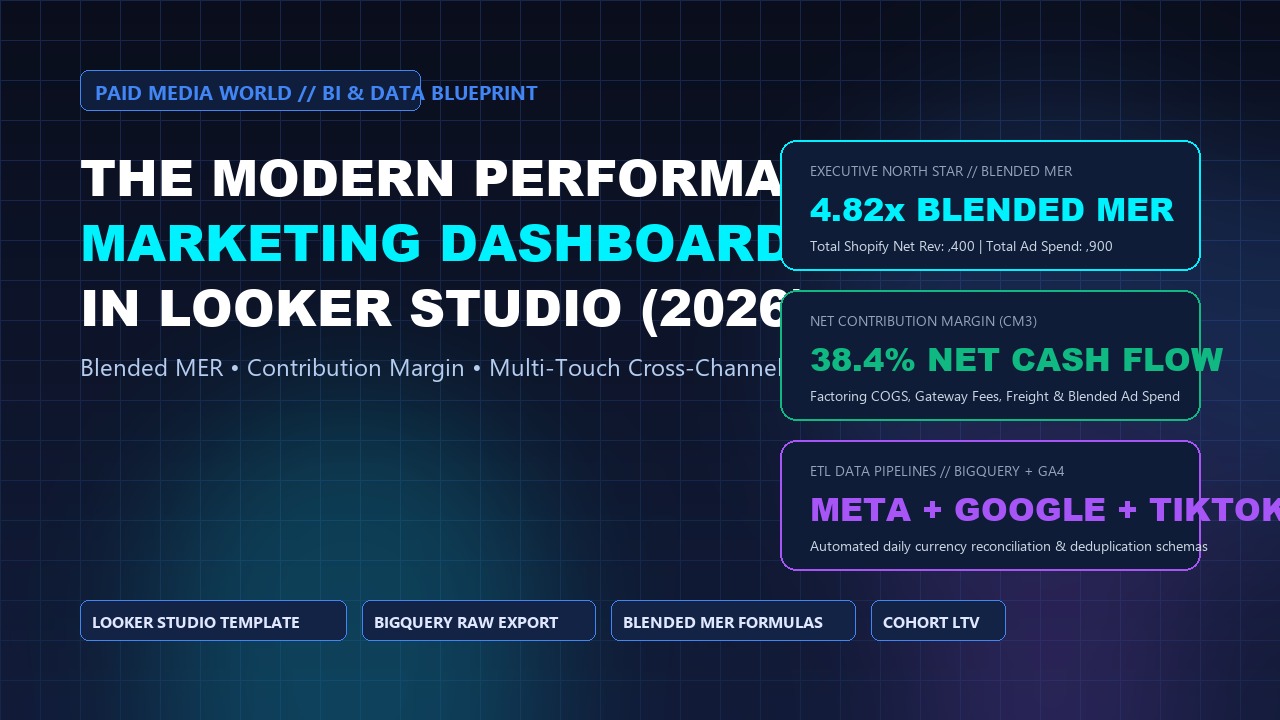
The antidote is building an executive single source of truth: The Modern Performance Marketing Dashboard in Google Looker Studio. By integrating ad spend from Meta, Google, and TikTok with actual merchant revenue, founders and media buyers unlock real-time visibility into Blended MER (Marketing Efficiency Ratio), Contribution Margin, and true unit economics.
The 4 Essential Metrics Missing from Standard Ad Platforms
Standard ad managers focus exclusively on siloed in-platform metrics. An executive Looker Studio dashboard must surface four mission-critical business health metrics:
1. Blended Marketing Efficiency Ratio (MER)
Measures total enterprise revenue generated per dollar of paid media invested across all platforms combined. If gross revenue is $300,000 and total spend across Google + Meta + TikTok is $60,000, your Blended MER is 5.0x.
2. Net Contribution Margin (CM3)
The ultimate indicator of paid acquisition health. It reveals the exact net profit dollars left over to cover operating overhead and payroll after all direct fulfillment and advertising expenses.
3. New Customer Acquisition Cost (nCAC)
Standard CPA blends cheap existing customer purchases with expensive new customer acquisition. nCAC isolates the actual cost of capturing an unprecedented net-new customer.
4. Paid Spend Share vs. Revenue Share
Identifies over-funded or under-funded channels. If TikTok consumes 35% of ad spend but only drives 8% of top-of-funnel customer discovery, capital must be reallocated.
The Data Pipeline Architecture: APIs to Looker Studio
How you ingest data into Looker Studio dictates dashboard speed, reliability, and maintenance overhead:
| Integration Model | Connectors / Tools | Latency & Performance | Recommended For |
|---|---|---|---|
| Direct Partner Connectors | Supermetrics, Funnel.io, Windsor.ai | Moderate (subject to API rate limits) | Ad spends $5k–$30k/mo |
| BigQuery Data Warehouse (ELT) | Fivetran / Airbyte → BigQuery → Looker | Ultra-Fast (< 1 sec cached queries) | Ad spends > $30k/mo (Enterprise standard) |
| Google Sheets Hybrid Pipeline | Automated API scripts → Google Sheets | Slow (sheet row limits) | Bootstrap testing and MVPs |
For high-spend accounts, we strongly advocate the BigQuery Data Warehouse approach (see our Fractional Attribution & BigQuery Blueprint). This decouples Looker Studio from live ad platform APIs, eliminating rate-limiting errors and sluggish report load times.
The 4-Page Executive Dashboard Blueprint
1 Page 1: The Executive North Star Cockpit
Designed specifically for founders, CMOs, and finance teams. Contains zero cluttered ad group tables. Features top-level scorecard tiles:
- Gross Revenue vs. Net Revenue (synced from Shopify / Stripe).
- Total Blended Ad Spend (Meta + Google Ads + TikTok + Bing).
- Blended MER Gauge (Target 4.5x with dynamic color coding: Red < 3.0x, Yellow 3.0–4.0x, Green > 4.0x).
- Daily Net Contribution Margin currency value.
- New Customer Acquisition Cost (nCAC) trendline over 30 days.
2 Page 2: Cross-Channel Paid Media Acquisition Matrix
Enables media buyers to compare channel efficiency side-by-side on an apples-to-apples basis:
- Columns: Channel, Spend, Impressions, Clicks, CPC, CTR, CPM, In-Platform Conversions, Platform ROAS, GA4 First-User Conversions.
- Visual Breakdown: 100% Stacked Bar chart of media spend allocation by channel vs. revenue attribution share.
- Allows instant identification of auction inflation (e.g. Meta CPMs spiking 40% week-over-week).
3 Page 3: Creative & Asset Performance Lab
Connects creative production directly to revenue outcomes:
- Creative thumbnail previews alongside ad names.
- Hook Rate (3-sec video views / impressions) — benchmark ≥ 35%.
- Hold Rate (15-sec video views / 3-sec views) — benchmark ≥ 25%.
- Outbound CTR and Cost Per Unique Click (CPC).
- Creative fatigue indicator: rolling 7-day CPA trend by creative asset.
4 Page 4: Customer Cohort Retention & LTV Expansion
Tracks long-term customer value to inform allowable customer acquisition costs:
- Day 0, Day 30, Day 60, and Day 90 Cumulative LTV Curves by acquisition channel.
- Repurchase Rate % by initial acquisition campaign.
- Average Order Value (AOV) progression over 12 months.
Looker Studio Calculated Fields: The Exact Formulas
Copy and paste these exact formulas into Looker Studio Calculated Fields when blending your multi-channel data sources:
SUM(Shopify_Net_Sales) / (SUM(Meta_Spend) + SUM(Google_Spend) + SUM(TikTok_Spend))
SUM(Shopify_Net_Sales) - SUM(COGS) - SUM(Shipping_Cost) - (SUM(Meta_Spend) + SUM(Google_Spend) + SUM(TikTok_Spend))
SUM(Meta_Video_3s_Views) / SUM(Meta_Impressions)
3 Common Looker Studio Pitfalls for Media Buyers
- The Aggregation Trap: Never blend pre-calculated ratios like CTR, ROAS, or CPC across platforms. You must always blend raw additive numerators and denominators (e.g.
SUM(Spend) / SUM(Purchases)), not average the averages. - Currency Mismatch Errors: If Meta bills in USD and Google Ads bills in INR or EUR, a direct sum creates financial gibberish. Always configure a Currency Normalization dimension or convert foreign currencies inside your BigQuery SQL model before piping to Looker.
- Date Partition & Time Zone Offsets: If Shopify reports in EST (UTC-5) while Google Ads is set to IST (UTC+5:30), single-day attribution comparisons will be distorted by an 11-hour gap. Re-align all data streams to a single standard business reporting time zone.
Deploy an Enterprise BI Dashboard for Your Brand
Tired of conflicting platform numbers? Paid Media World builds custom BigQuery and Looker Studio performance dashboards for high-growth brands.
The Modern Performance Marketing Dashboard in: Frequently Asked Questions
Is Google Looker Studio free to use for performance marketing?
Google Looker Studio is completely free. Native Google connectors (Google Ads, GA4, BigQuery, Google Sheets) carry zero software subscription cost. Third-party partner connectors (like Supermetrics) require a monthly license, or you can utilize open-source BigQuery pipelines to keep ongoing connector costs near zero.
How frequently should data refresh in an executive dashboard?
For strategic decision-making, an automated 4-hour or daily (24-hour) refresh cycle is optimal. Real-time streaming is rarely necessary for media buying and frequently causes API rate throttling and excessive data warehouse compute fees.