
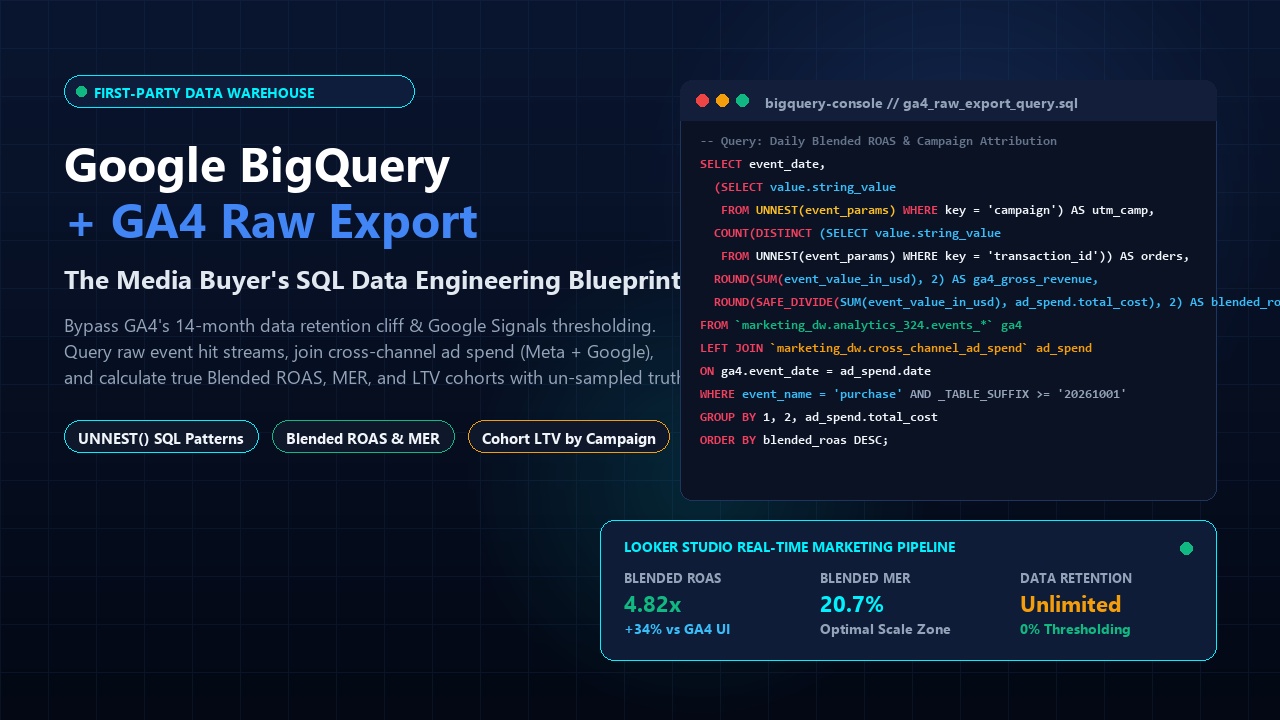
In modern performance marketing, relying solely on the standard Google Analytics 4 (GA4) web interface is like flying blind with foggy instruments. Digital media buyers managing substantial budgets on Meta Ads, Google Ads, and TikTok constantly battle four fatal limitations in GA4: the aggressive 14-month data retention cliff, heavy Google Signals data thresholding, unassigned traffic cardinality bloat, and rigid attribution black boxes.
The antidote is building your own first-party marketing data warehouse on Google BigQuery. Because Google provides a free native link that streams un-sampled, raw hit-level event data from GA4 directly into BigQuery, performance marketers can gain total ownership of their historical customer data. In this comprehensive 2026 blueprint, we walk through the end-to-end setup, schema deconstruction, production SQL queries for blended ROAS and LTV, and cost-optimization strategies to keep your data warehouse running for pennies per month.
Table of Contents
- 1. Why the GA4 Web Interface Fails Media Buyers
- 2. Step-by-Step: Linking GA4 to Google BigQuery in GCP
- 3. Decoding the GA4 BigQuery Schema: Mastering UNNEST()
- 4. 5 Production-Ready SQL Queries for Digital Marketers
- 5. Ingesting Meta, Google & TikTok Ad Spend into BigQuery
- 6. Building Executive Dashboards in Looker Studio
- 7. BigQuery Cost Control: Partitioning, Clustering & Free Tier Rules
- 8. Frequently Asked Questions (PAA Breakdown)
1. Why the GA4 Web Interface Fails Media Buyers
While GA4 offers advanced machine learning capabilities, its standard user interface introduces significant friction for growth marketers analyzing granular campaign performance:
- The 14-Month Data Retention Cliff: In free GA4 properties, standard event-level user exploration data expires after a maximum of 14 months (and defaults to only 2 months unless manually changed). You cannot perform multi-year cohort analysis or evaluate Year-over-Year (YoY) Black Friday retention trends in the GA4 UI.
- Data Thresholding & Google Signals: When Google Signals is active to track cross-device users, Google applies automated privacy thresholds. If a campaign or ad set generates low event counts, GA4 masks rows entirely, showing orange warning icons and hiding high-converting long-tail keyword data.
- Cardinality & "(Other)" Row Bloat: High-traffic sites with detailed UTM parameters (source, medium, campaign, content, term) frequently exceed daily dimension limits, collapsing critical granular ad data into an unusable "(other)" row.
- Modeled vs. Ground-Truth Data: The GA4 UI blends behavioral modeling and consented data. For financial reporting, media buyers require deterministic, un-modeled transaction logs that match their Shopify backend and Stripe ledger to the penny.
2. Step-by-Step: Linking GA4 to Google BigQuery in GCP
Setting up the raw data pipeline takes under 15 minutes and requires zero code:
- Create a Google Cloud Project (GCP): Visit the Google Cloud Console, create a project titled
[Brand]-Marketing-Warehouse, and enable billing. Google provides 10 GB of active storage and 1 TB of query processing completely free every month. - Navigate to GA4 Admin: Open your GA4 Property, click Admin (Gear Icon) > Product Links > BigQuery Links.
- Link Project & Select Region: Choose your GCP project. Set your dataset location carefully (e.g.,
US (multi-region)orEU (multi-region))—this cannot be changed once created. - Configure Export Streams:
- Daily Export: Creates a daily partitioned table (
events_YYYYMMDD) containing verified, finalized event records from the previous day. - Streaming Export: Streams real-time raw events into an intraday table (
events_intraday_YYYYMMDD) within seconds of occurrence (ideal for real-time monitoring).
- Daily Export: Creates a daily partitioned table (
- Include Advertising Identifiers: Ensure user data export is checked so that Google Click IDs (
gclid) and pseudo user IDs are populated.
3. Decoding the GA4 BigQuery Schema: Mastering UNNEST()
Unlike relational SQL databases where each parameter has its own column, GA4 utilizes a nested, repeated record architecture to support limitless custom dimensions without table schema changes. Inside each event row, all event parameters are packed into an array called event_params containing key, value.string_value, value.int_value, and value.float_value.
To extract a specific parameter like page_location or campaign, you must use the SQL UNNEST() operator:
-- Conceptual SQL Example: How UNNEST() unpacks repeated parameters
SELECT
  event_date,
  event_name,
  (SELECT value.string_value FROM UNNEST(event_params) WHERE key = 'page_location') AS page_url,
  (SELECT value.string_value FROM UNNEST(event_params) WHERE key = 'campaign') AS utm_campaign
FROM
  `your-project-id.analytics_123456789.events_*`
WHERE
  _TABLE_SUFFIX BETWEEN '20261001' AND '20261014'
LIMIT 100;
4. 5 Production-Ready SQL Queries for Digital Marketers
Query 1: Extracting Clean Purchase Revenue by UTM Campaign & Source
-- Query 1: Clean eCommerce Transactions with Campaign Attribution
SELECT
  event_date,
  (SELECT value.string_value FROM UNNEST(event_params) WHERE key = 'source') AS traffic_source,
  (SELECT value.string_value FROM UNNEST(event_params) WHERE key = 'medium') AS traffic_medium,
  (SELECT value.string_value FROM UNNEST(event_params) WHERE key = 'campaign') AS campaign_name,
  (SELECT value.string_value FROM UNNEST(event_params) WHERE key = 'transaction_id') AS order_id,
  event_value_in_usd AS revenue_usd
FROM
  `your-project.analytics_123456789.events_*`
WHERE
  event_name = 'purchase'
  AND _TABLE_SUFFIX >= FORMAT_DATE('%Y%m%d', DATE_SUB(CURRENT_DATE(), INTERVAL 30 DAY))
ORDER BY
  event_date DESC;
Query 2: Multi-Touch Conversion Path Reconstruction
Track every marketing touchpoint a user engaged with prior to their first purchase:
-- Query 2: User Journey & Touchpoint Sequence Prior to Conversion
WITH UserJourneys AS (
  SELECT
    user_pseudo_id,
    TIMESTAMP_MICROS(event_timestamp) AS hit_time,
    event_name,
    (SELECT value.string_value FROM UNNEST(event_params) WHERE key = 'source') AS source,
    (SELECT value.string_value FROM UNNEST(event_params) WHERE key = 'medium') AS medium,
    (SELECT value.string_value FROM UNNEST(event_params) WHERE key = 'campaign') AS campaign
  FROM
    `your-project.analytics_123456789.events_*`
  WHERE
    _TABLE_SUFFIX >= FORMAT_DATE('%Y%m%d', DATE_SUB(CURRENT_DATE(), INTERVAL 90 DAY))
    AND event_name IN ('session_start', 'purchase')
)
SELECT
  user_pseudo_id,
  ARRAY_AGG(CONCAT(IFNULL(source,'direct'), ' / ', IFNULL(medium,'none'), ' (', IFNULL(campaign,'organic'), ')')
            ORDER BY hit_time) AS touchpoint_path,
  COUNTIF(event_name = 'purchase') AS total_purchases
FROM
  UserJourneys
GROUP BY
  user_pseudo_id
HAVING
  total_purchases > 0
LIMIT 50;
Query 3: 30, 60 & 90-Day Cohort LTV by Acquisition Channel
-- Query 3: Cohort Lifetime Value (LTV) Calculation
WITH FirstPurchase AS (
  SELECT
    user_pseudo_id,
    MIN(PARSE_DATE('%Y%m%d', event_date)) AS first_order_date,
    (SELECT value.string_value FROM UNNEST(event_params) WHERE key = 'campaign') AS acquisition_campaign
  FROM
    `your-project.analytics_123456789.events_*`
  WHERE
    event_name = 'purchase'
  GROUP BY
    user_pseudo_id, acquisition_campaign
),
AllPurchases AS (
  SELECT
    user_pseudo_id,
    PARSE_DATE('%Y%m%d', event_date) AS order_date,
    event_value_in_usd AS order_value
  FROM
    `your-project.analytics_123456789.events_*`
  WHERE
    event_name = 'purchase'
)
SELECT
  f.acquisition_campaign,
  COUNT(DISTINCT f.user_pseudo_id) AS cohort_size,
  ROUND(SUM(CASE WHEN DATE_DIFF(a.order_date, f.first_order_date, DAY) = 0 THEN a.order_value ELSE 0 END), 2) AS day_0_revenue,
  ROUND(SUM(CASE WHEN DATE_DIFF(a.order_date, f.first_order_date, DAY) <= 30 THEN a.order_value ELSE 0 END), 2) AS day_30_ltv_revenue,
  ROUND(SUM(CASE WHEN DATE_DIFF(a.order_date, f.first_order_date, DAY) <= 60 THEN a.order_value ELSE 0 END), 2) AS day_60_ltv_revenue,
  ROUND(SUM(CASE WHEN DATE_DIFF(a.order_date, f.first_order_date, DAY) <= 90 THEN a.order_value ELSE 0 END), 2) AS day_90_ltv_revenue
FROM
  FirstPurchase f
JOIN
  AllPurchases a ON f.user_pseudo_id = a.user_pseudo_id
GROUP BY
  f.acquisition_campaign
HAVING
  cohort_size >= 10
ORDER BY
  day_90_ltv_revenue DESC;
5. Ingesting Meta, Google & TikTok Ad Spend into BigQuery
GA4 raw data captures the conversion and revenue side, but to calculate true Blended ROAS and Marketing Efficiency Ratio (MER), you must join this data with your ad spend across channels.
- Automated Connectors: Use automated modern ETL tools like Fivetran, Airbyte, or Supermetrics to pipe daily ad spend, impressions, and clicks from Meta Ads Manager, Google Ads API, and TikTok Ads directly into adjacent BigQuery tables.
- Unified Blended View: Create a master SQL view that joins
meta_ad_spend.dateandgoogle_ad_spend.datewith yourga4_raw_revenue.date. This produces an infallible daily financial dashboard that cannot be skewed by ad network attribution bias.
6. Building Executive Dashboards in Looker Studio
Never connect Looker Studio directly to raw events_* tables with open wildcards, as this will re-scan gigabytes of data every time an executive refreshes the dashboard. Instead, follow the Scheduled Query Architecture:
- Write a summary SQL query that aggregates daily metrics (Date, Source, Medium, Campaign, Spend, Orders, Revenue).
- Schedule the query to run once every night at 2:00 AM UTC in BigQuery, inserting results into a lightweight reporting table:
daily_marketing_kpi_summary. - Connect Looker Studio directly to
daily_marketing_kpi_summary. Your reports will load in under 1 second and cost less than $0.05 per month in cloud compute.
7. BigQuery Cost Control: Partitioning, Clustering & Free Tier Rules
BigQuery charges $6.25 per terabyte (TB) of data scanned beyond the 1 TB monthly free quota. High-traffic eCommerce sites with tens of millions of events can accidentally run expensive queries unless proper guardrails are applied:
3 Golden Rules of BigQuery Cost Hygiene
- Always Filter by _TABLE_SUFFIX: Never run
FROM events_*without a date range constraint. Restricting your query to_TABLE_SUFFIX BETWEEN '20261001' AND '20261014'instructs BigQuery to only scan those 14 daily partitions, slashing scanned bytes by 95%+. - Avoid SELECT *: Only select the specific columns required. BigQuery is a columnar database; selecting 50 unused columns multiplies query cost exponentially.
- Create Partitioned & Clustered Materialized Tables: For active analytics, partition intermediate tables by
event_dateand cluster byevent_nameandtraffic_source.
8. Frequently Asked Questions (PAA Breakdown)
Is the GA4 BigQuery export free?
Yes. The connection between Google Analytics 4 and Google BigQuery is completely free for standard properties up to 1 million events per day. Google Cloud also provides 10 GB of free storage and 1 TB of free query processing every month.
Why does GA4 UI show data thresholding while BigQuery does not?
The GA4 web interface applies privacy thresholding when Google Signals is enabled to prevent individual user identification on low-volume rows. The BigQuery raw export delivers un-sampled, hit-level event records directly from the measurement protocol without UI thresholding.
What is the difference between Daily and Streaming export in GA4?
The Daily export creates a single finalized, validated table of the previous day's events every 24 hours. The Streaming export continuously sends events into an intraday table within seconds of collection, enabling real-time dashboards.
How do you unnest event parameters in BigQuery?
Because event parameters in GA4 are stored in repeated arrays, you extract them using the UNNEST(event_params) function paired with a scalar subquery (e.g., (SELECT value.string_value FROM UNNEST(event_params) WHERE key = 'campaign')).
How can digital marketers prevent BigQuery billing surprises?
Always filter queries using _TABLE_SUFFIX to scan only specific date ranges, avoid SELECT *, set monthly budget alerts in the Google Cloud Billing console, and use scheduled summary tables for Looker Studio dashboards.